

Climate Migration:
A Canadian & Global View
Climate migration is already happening around the world. We wanted to explore the complexity of this phenomenon, both globally and here in Canada, with a series of data visualizations that look at current trends, future implications, and global inequities.
What is Climate Migration?
Climate migration involves the permanent relocation of individuals, either within their own country or internationally, as a result of environmental disasters driven by climate change. Intense droughts and water scarcity, severe fires and extreme heat, rising sea levels and flooding are among the leading factors of climate migration.
Over 3.3 billion people live in areas vulnerable to climate-driven disasters. The effects of climate change will increase rapidly in the future — impacting more people, and at a more severe level.

Projected Internal Climate Migrants By Region (2050)


The World Bank estimates that by 2050, 216 million people could be displaced within their own countries due to climate change.
Data Visualization 1
The Future of Global Climate Migrations
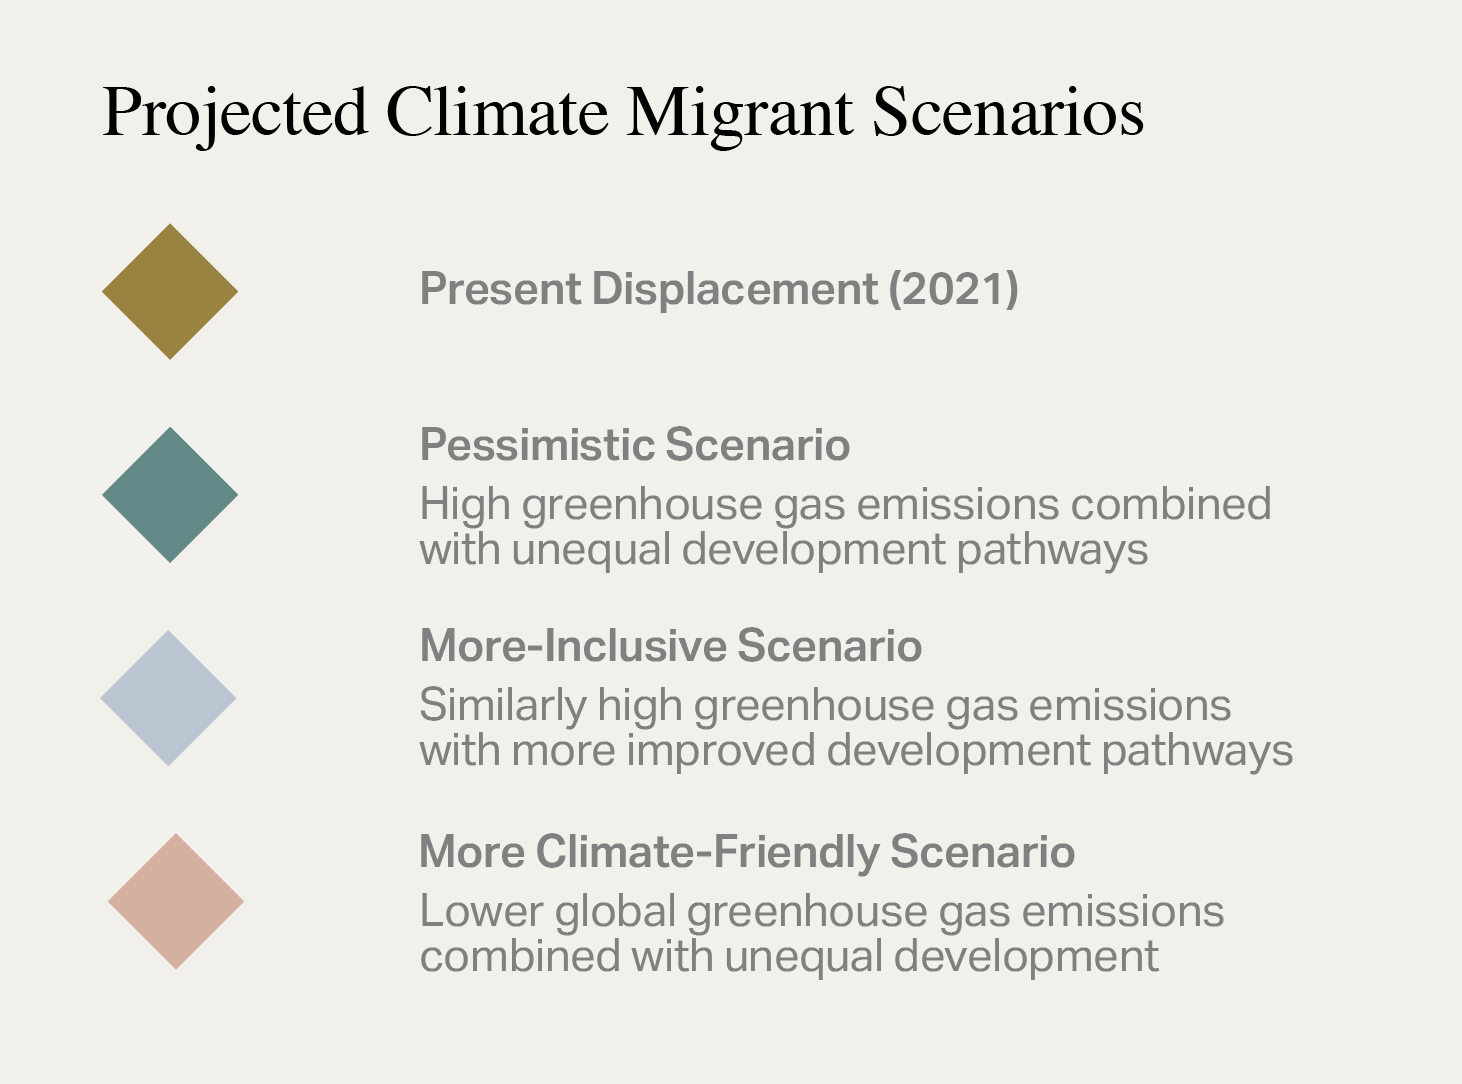
The visualization below draws on data from the World Bank Group’s website and their 2021 report, Groundswell: Acting on Internal Climate Migration. It depicts both current (2021) and projected (2050) numbers of internal migrants across various global regions, based on three different scenarios outlined to the right. For each region, we’ve also included CO2 emissions for 2020, measured in metric tons per capita, to underscore the disparity between regions in terms of carbon output and climate migration.


The data highlights a striking imbalance: poorer nations with the lowest emissions are disproportionately affected by higher levels of climate-induced displacement, while wealthier, higher-emitting countries experience far fewer.
How is climate migration affecting us here in Canada?
Unsurprisingly, Canada’s changing climate is causing deep and lasting impacts on our society, economy, and environment. Environmental changes directly impact those living in hazardous regions such as low-lying coastlines and wildfire risk zones, as well as populations with limited resources or unstable infrastructure. These populations tend to migrate to inland and urban areas with more resilient infrastructure capable of withstanding climate-driven disasters. This in turn causes rapid population growth and increased population density in these areas, introducing added challenges such as reduced resources and housing affordability.
Data Visualization 2
Canada’s Climate-Driven Migration Hotspots
Migration-In Hotspots:
Areas people are moving to
Migration-Out Hotspots:
Areas people are moving to
The visualization below illustrates predicted “migration-in” hotspots within Canada — areas that are considered desirable destinations for safety, refuge, and security. Hazardous climate-induced regions are expected to see an increase in “migration-out,” as residents move away from these areas. Conversely, particularly metropolitan and urban centres that face fewer climate-induced risks and are located away from coastal shores or wildfire-prone forests, will experience an influx of migration.

Migration challenges posed by climate change will disproportionately affect our Indigenous communities, who will face scarce food supplies and poor nutrition, habitat loss, and extreme weather conditions as climate-driven disasters become more severe and frequent.
Data Visualization 3
Climate Migration Dynamics:
A Comparative Analysis
Between 2019–2022, more than 20 million displacements were recorded globally each year due to climate-driven events.
High-income countries with the largest greenhouse gas emissions typically face fewer immediate impacts from climate change due to their geographical locations, advanced infrastructure, and greater resources for mitigation and adaptation.
By contrast, low-income countries which contribute the least to global carbon emissions are disproportionately affected by the adverse effects of climate change. These nations often have higher population densities and fewer resources to cope with climate-driven disasters such as extreme weather events, rising sea levels, and prolonged droughts. As a result, they experience more severe disruptions to their economies, public health, food security, agricultural growth, and livelihoods.
A close-up of Canada and Malawi’s data illustrates the disparity between income per capita, emissions produced, and climate-driven displacement in high- and low-income countries:


Below: A different view of the same data, illustrating the disparity between income per capita, emissions produced, and climate-driven displacement in high- and low-income countries:

Climate migration is a pressing global issue that underscores the inequities in both the causes and consequences of climate change.
While high-emitting, wealthier nations like Canada may experience fewer direct effects of climate-driven disasters, they will still face significant challenges related to internal migration, such as overburdened infrastructure and strained resources in urban centers. Meanwhile, poorer nations, despite contributing the least to global carbon emissions, will bear the brunt of displacement, resource scarcity, and economic disruption. Addressing climate migration requires not only immediate adaptation and mitigation efforts but also a commitment to global cooperation and equitable climate action to protect the most vulnerable populations from its devastating impacts.
“We are living in a time of profound disconnection, where our individual pursuits have taken precedence over the well-being of the earth.”
— The Great Derangement by Amitav Ghosh