DEMOCRACY IN MOTION
DemocracyXChange 2023, DesignTO 2023, Nuit Blanche 2022
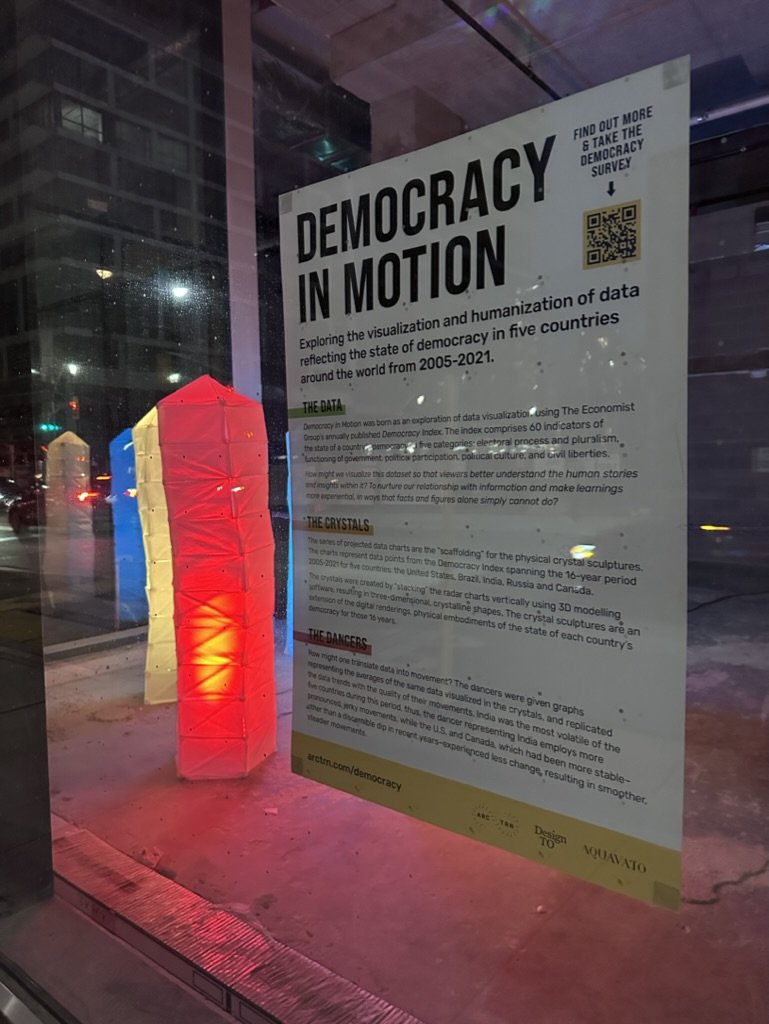
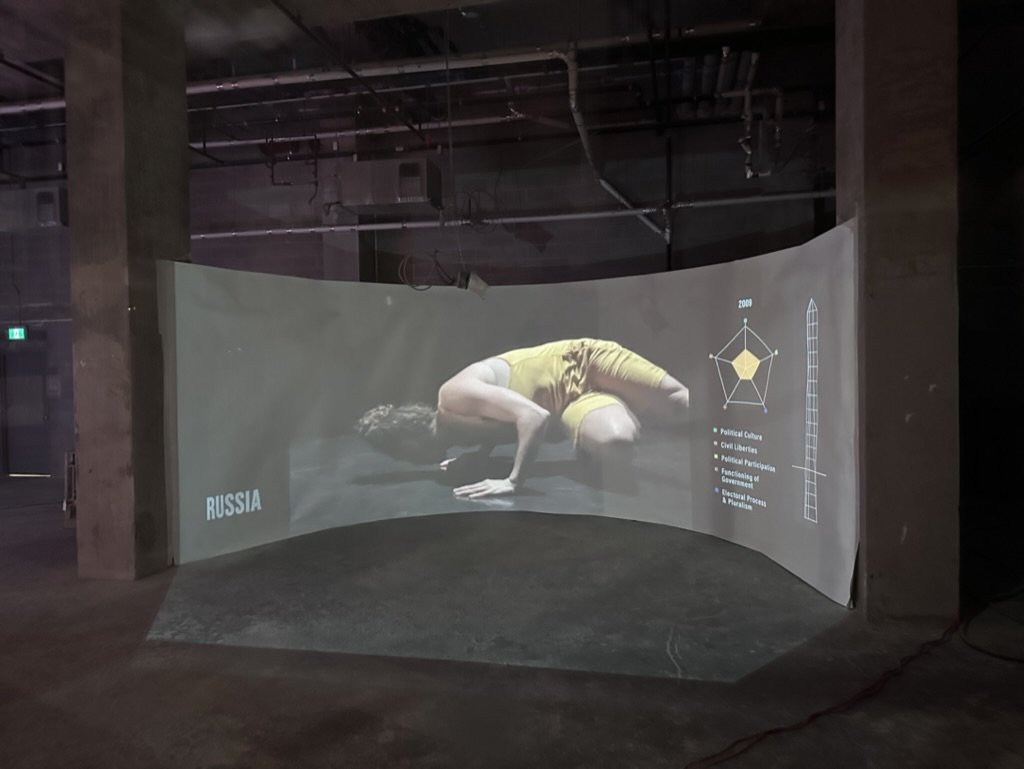
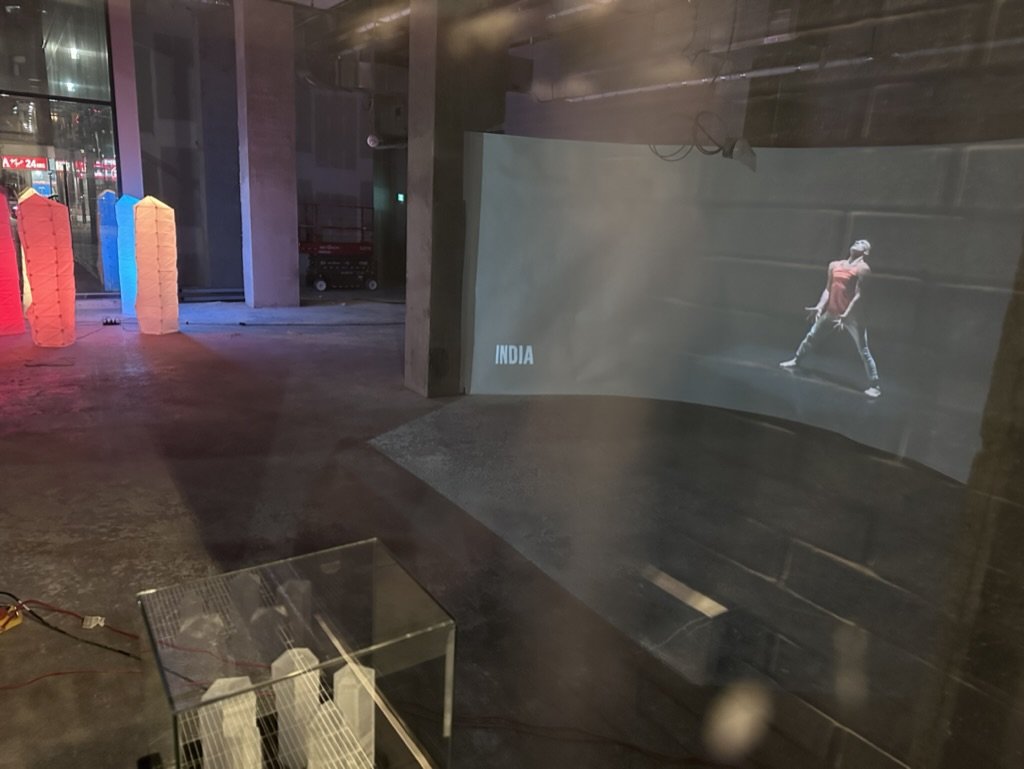
Democracy in Motion is an original multi-media installation exploring the visualization of an existing data set about the state of democracy in countries around the world. The installation includes a dance film, musical score, data projection, and display of 3D crystalline-shaped models inspired by the data.
The installation explores how we might better understand human stories and insights within data to nurture our relationship with information and make learnings more experiential, in ways that facts and figures alone simply cannot do.
Visualizing Democracy Data
Democracy in Motion was born as an exploration of data from The Economist Group's annually published Democracy Index. The index comprises 60 indicators of the state of a country’s democracy, in five categories:
Electoral process and pluralism
Functioning of government
Political participation
Political culture
Civil liberties
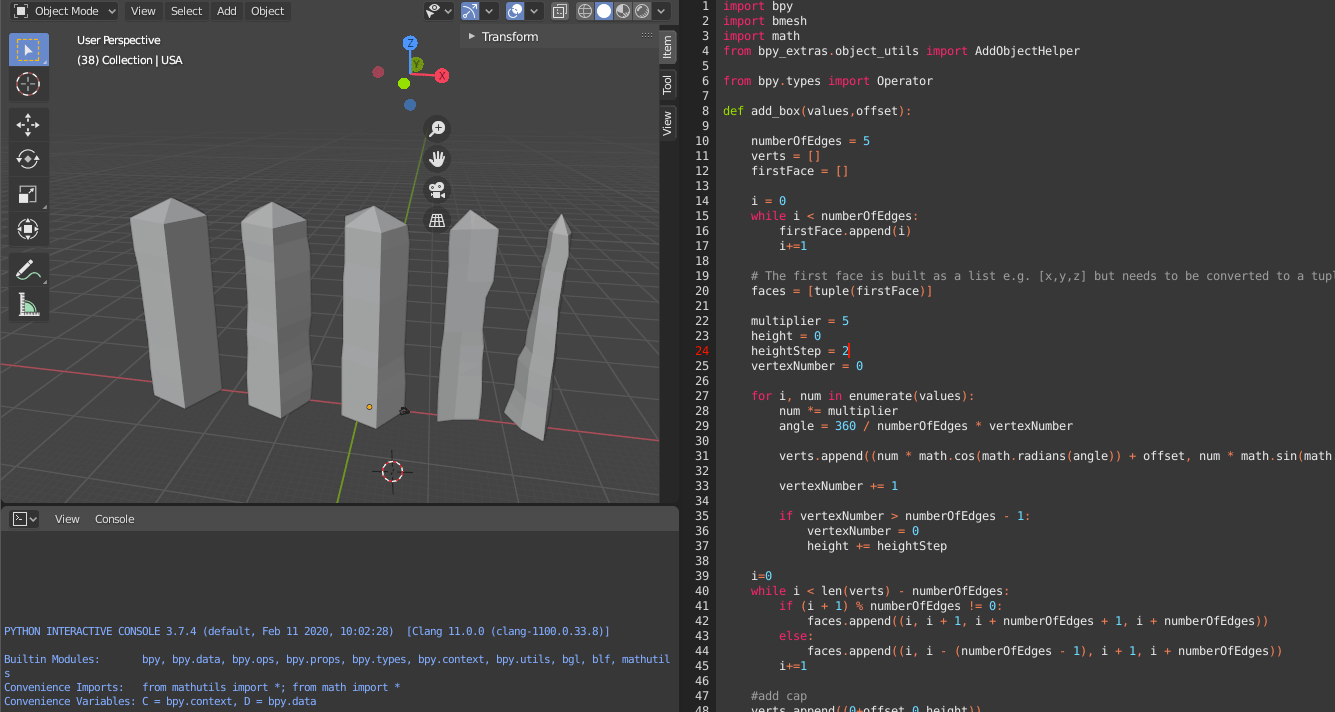
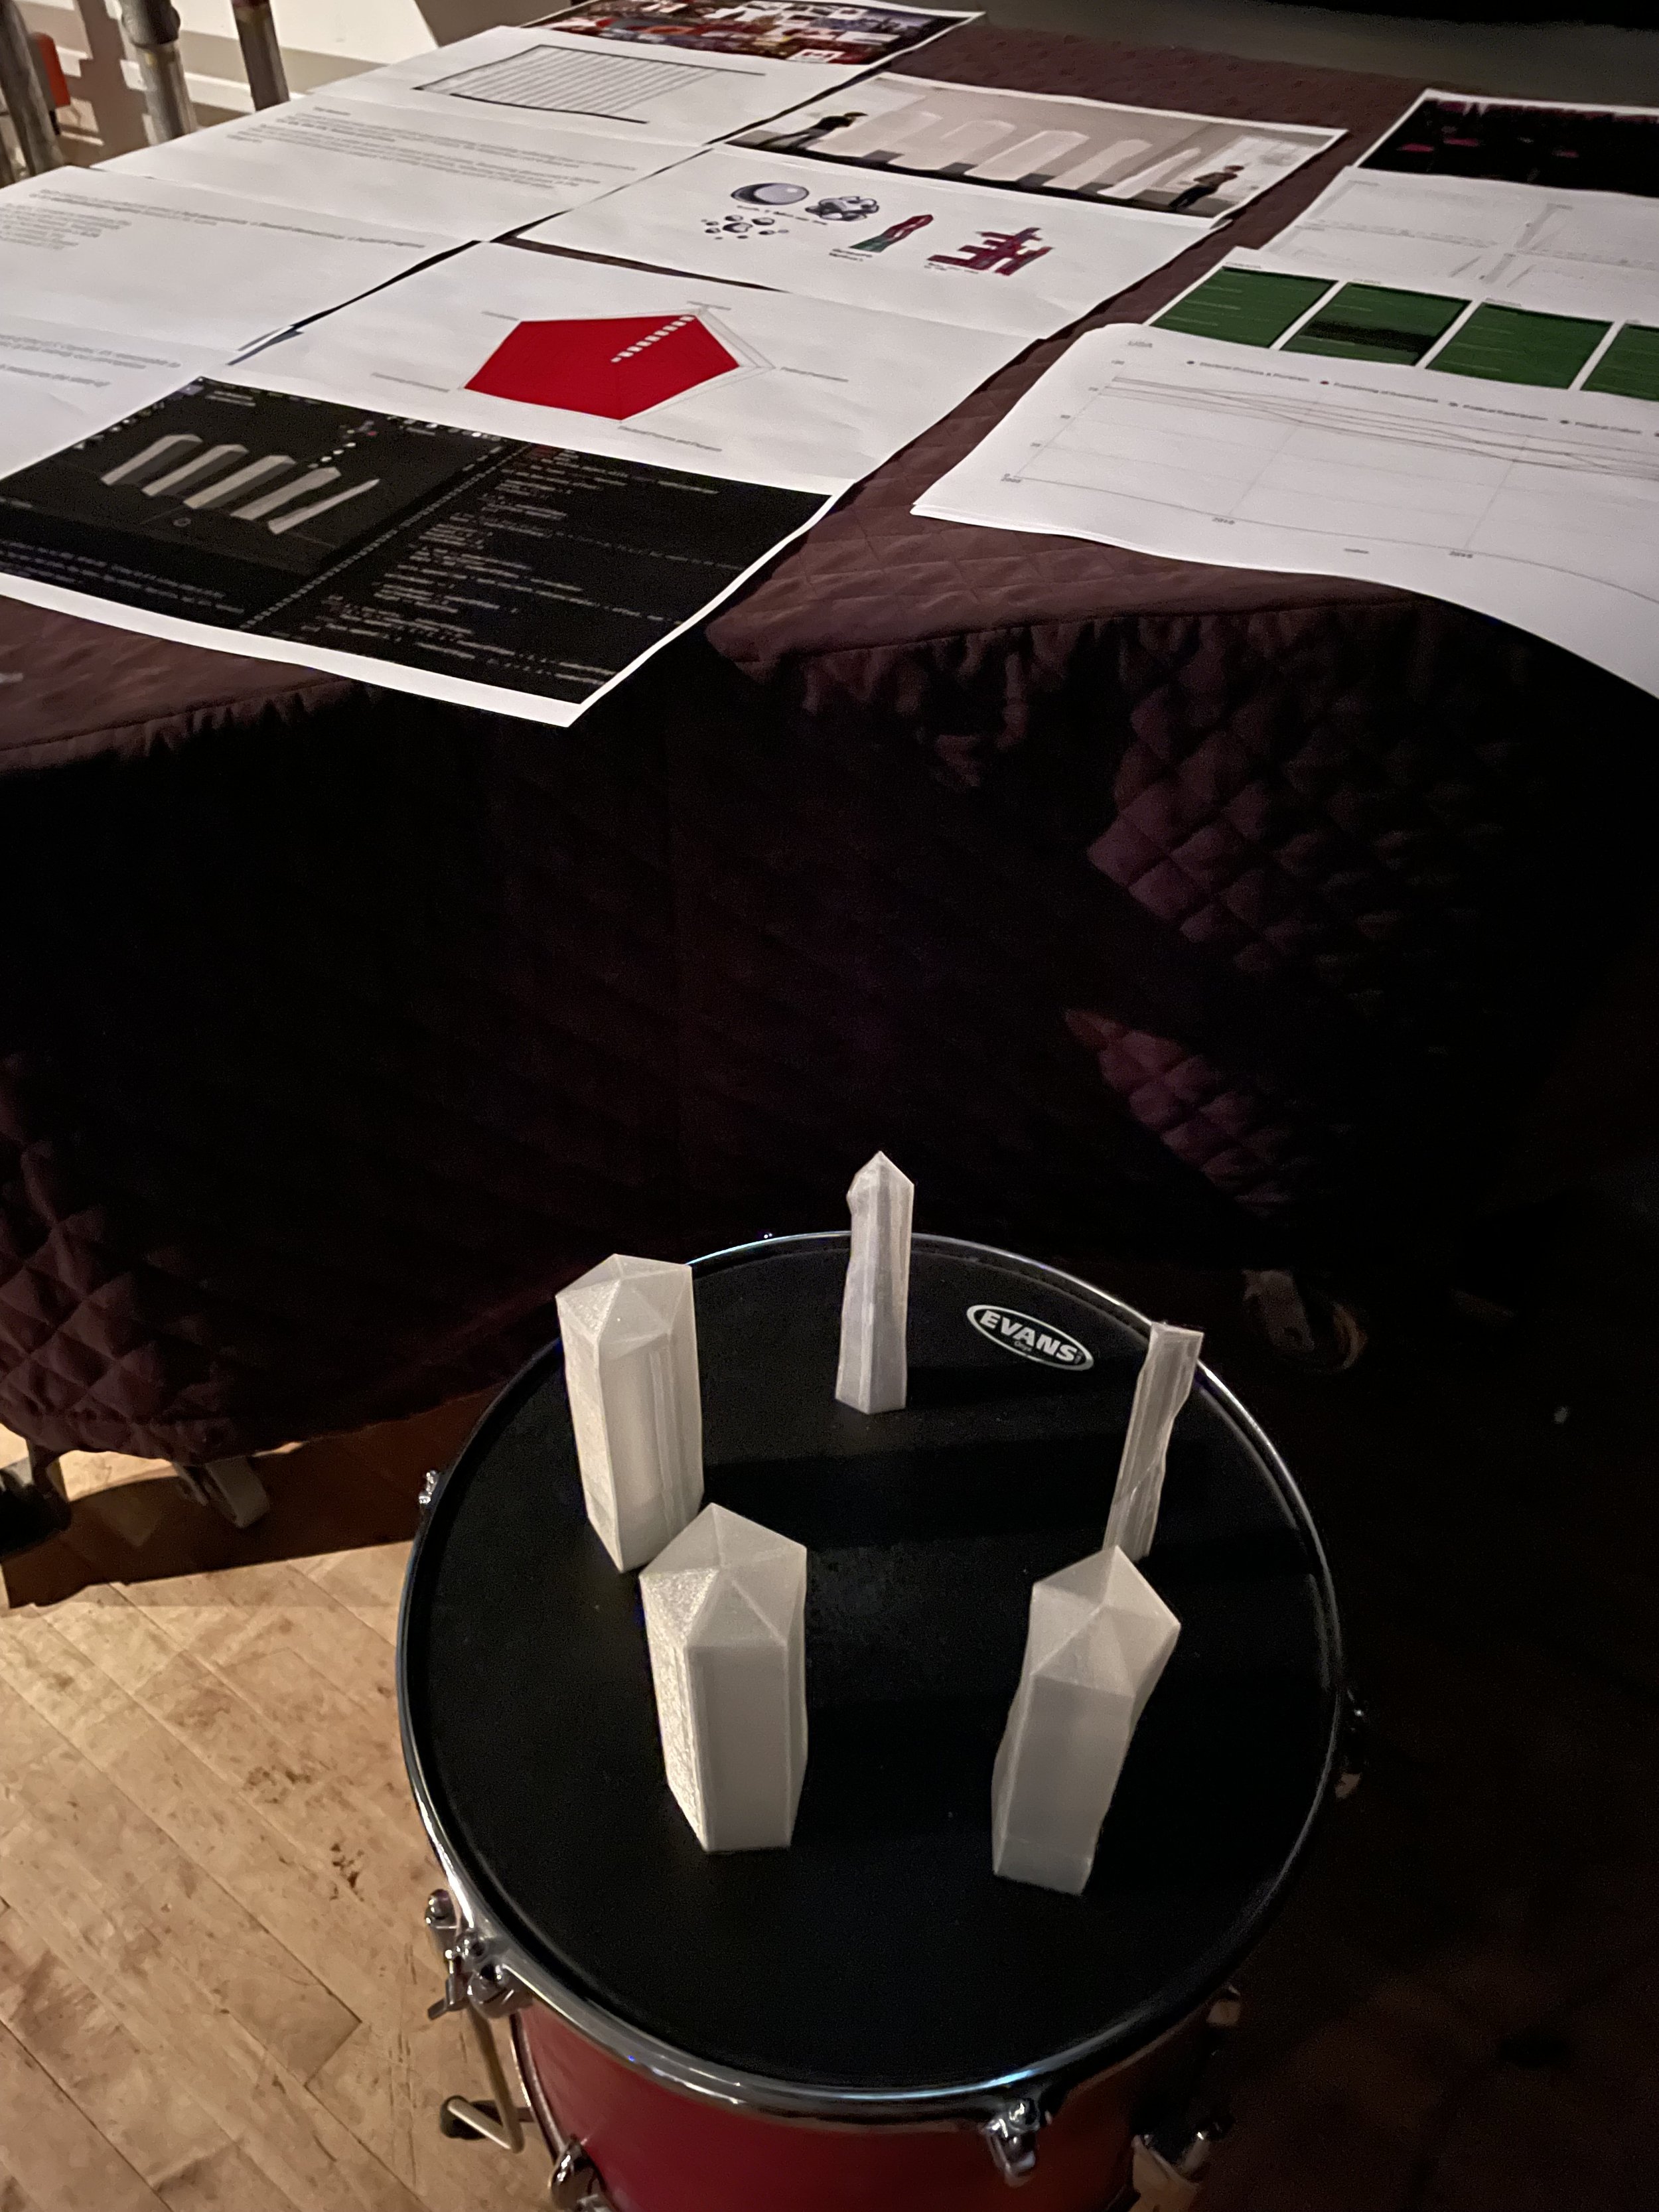
Using data points corresponding to these categories, a series of radar charts representing five countries between 2005-2021 was created. Using 3D modelling software, stacking these charts (see image below) created crystalline shapes that embodied the condition of democracy existing in each country during this period. Taking this one step further, we then 3D-printed these crystalline shapes to create physical objects.
Visit our Crystal Vision story to learn more about the crystals.

From Data… to Sound and Dance
After rendering and printing the crystals as three-dimensional objects, we considered other media that might be suitable to express the data, as well as other senses that could be engaged. In particular, we were interested in how music might be applied, and proceeded to assign sounds to each of the indices. A layered soundscape soon evolved for each country that could either be played individually or woven together in conjunction with other countries, creating a fascinating and “otherworldly” atmosphere. In seeking to take our exploration of sound further, we partnered with composer and musician Marc Ganetakos for the Nuit Blanche installation to compose a musical score with data from Canada, the United States, India, Brazil, and Russia.
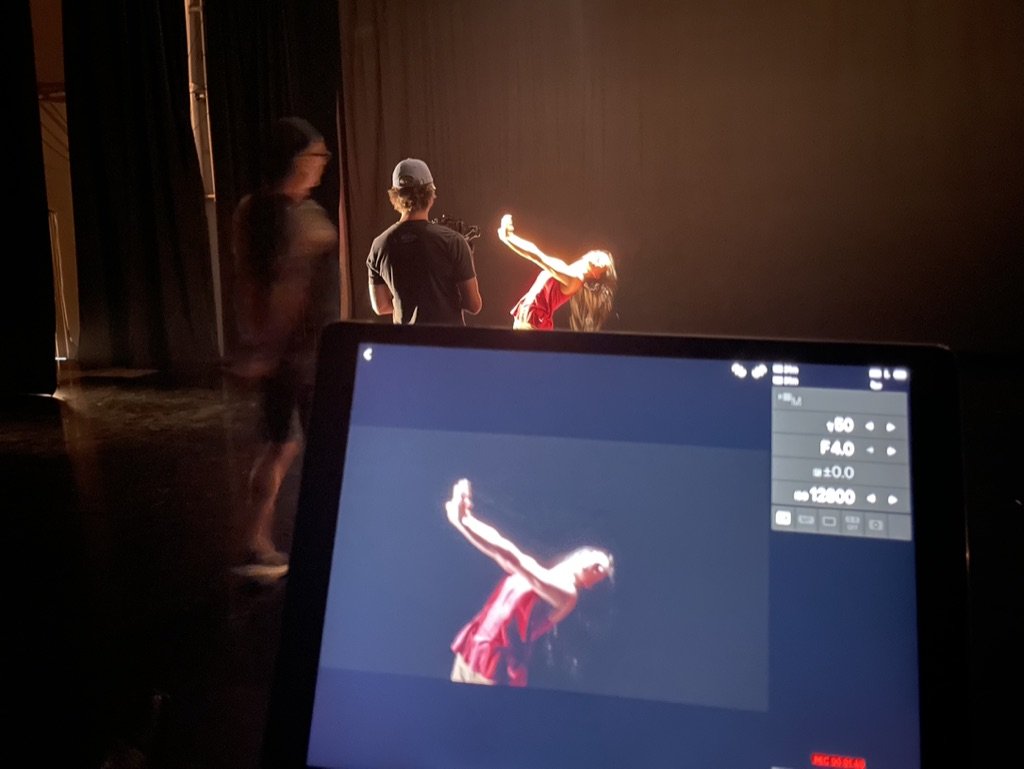
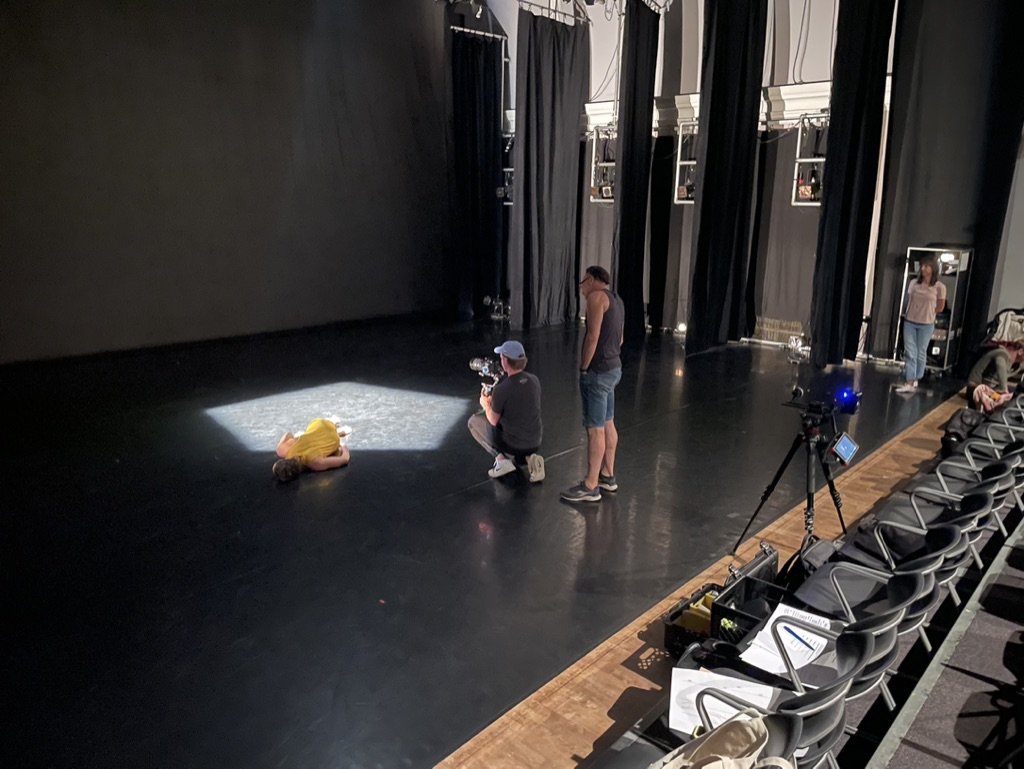
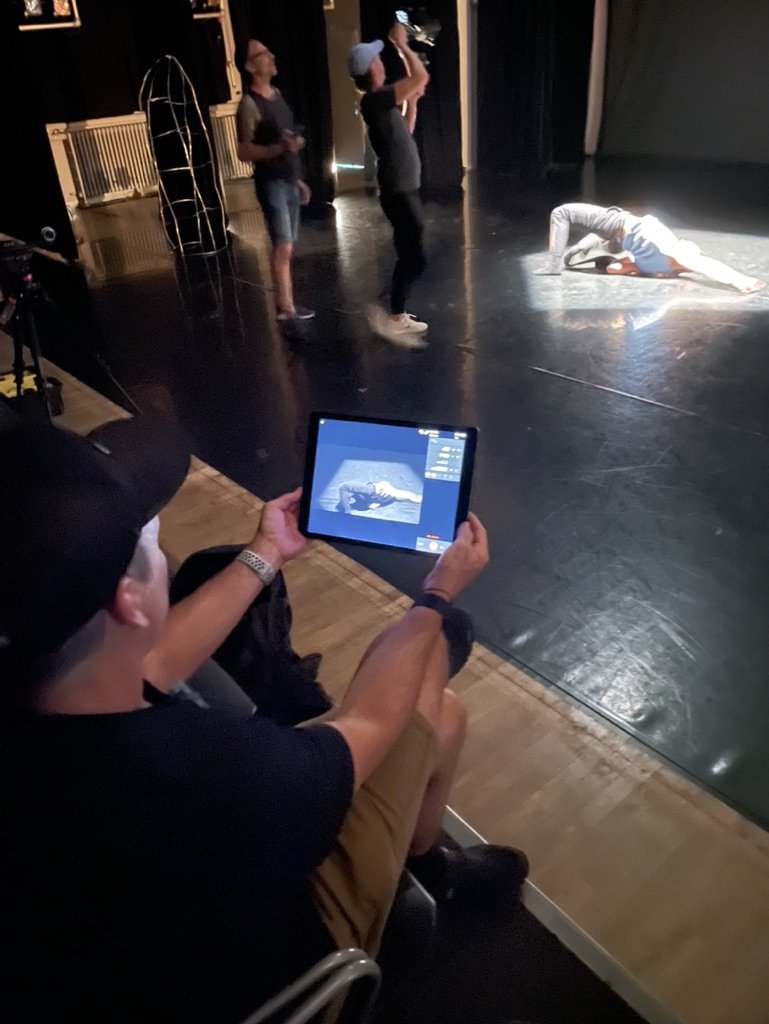
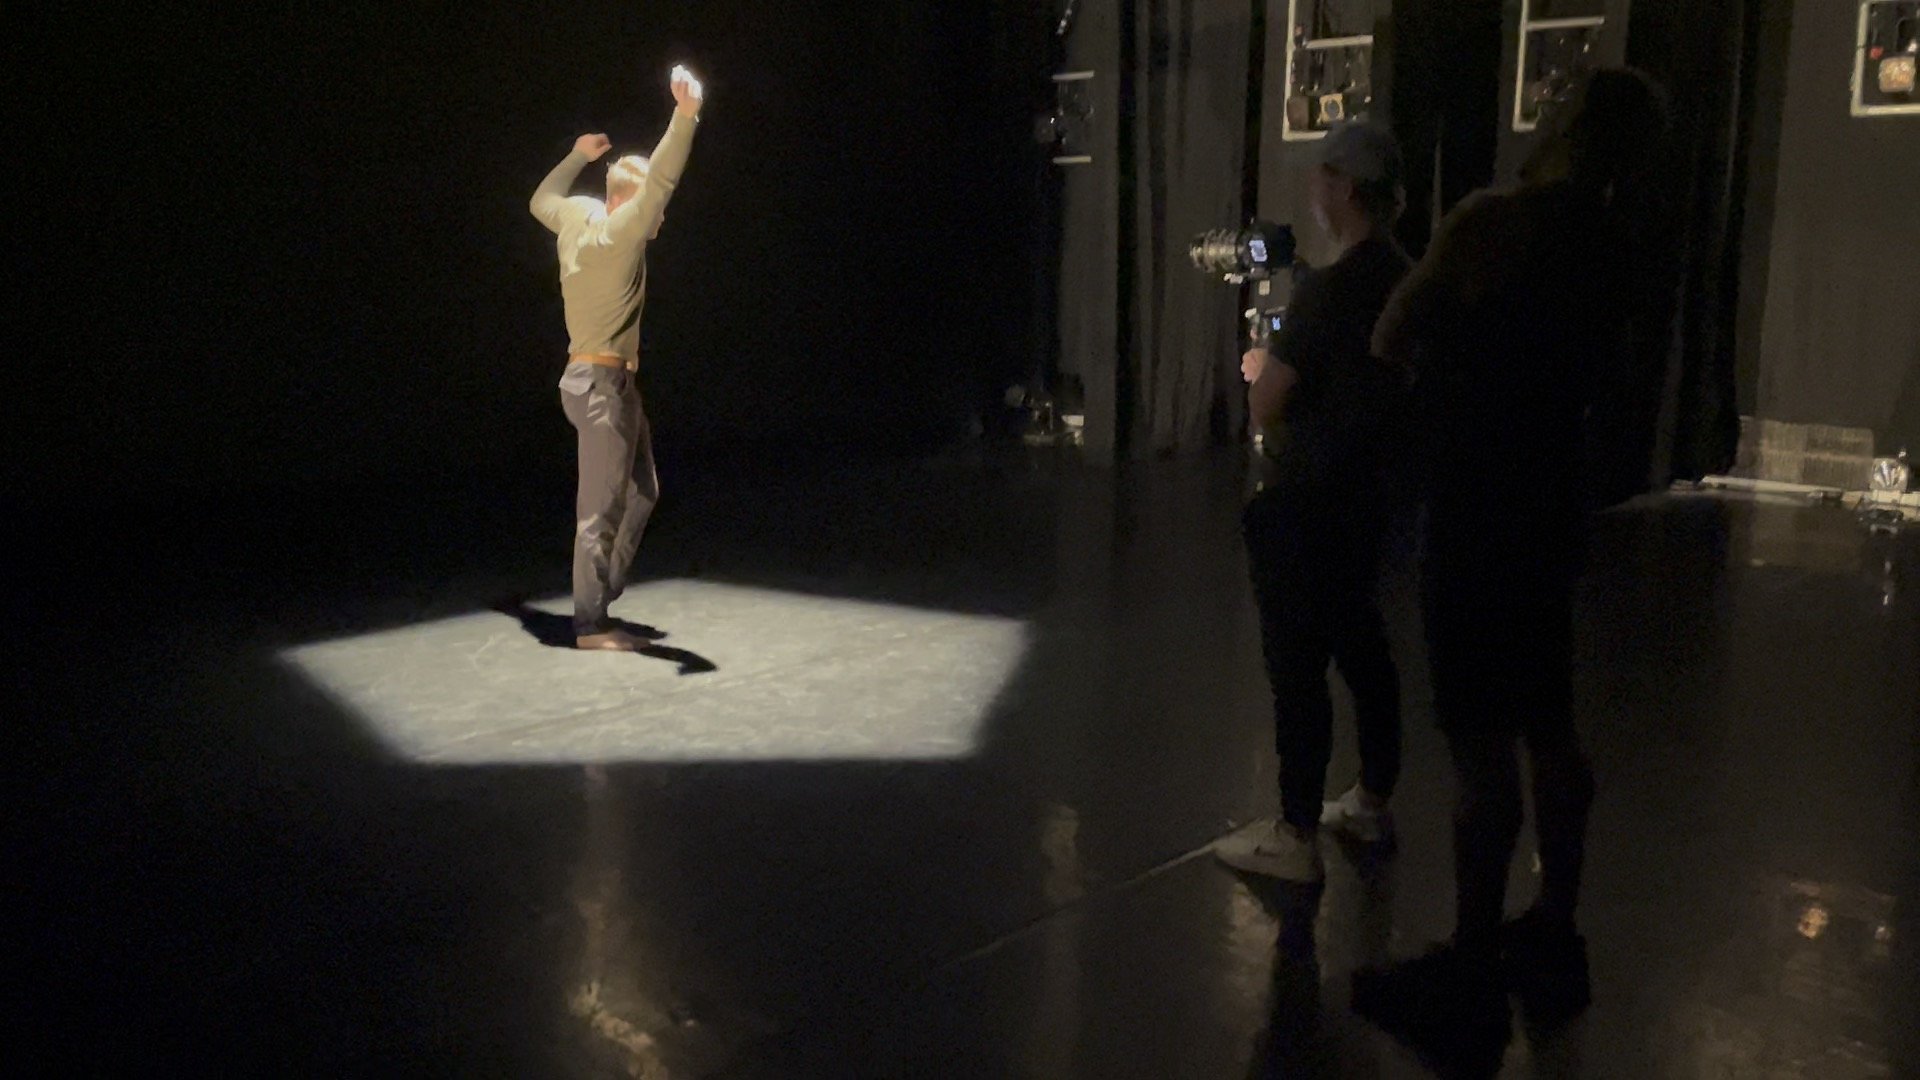
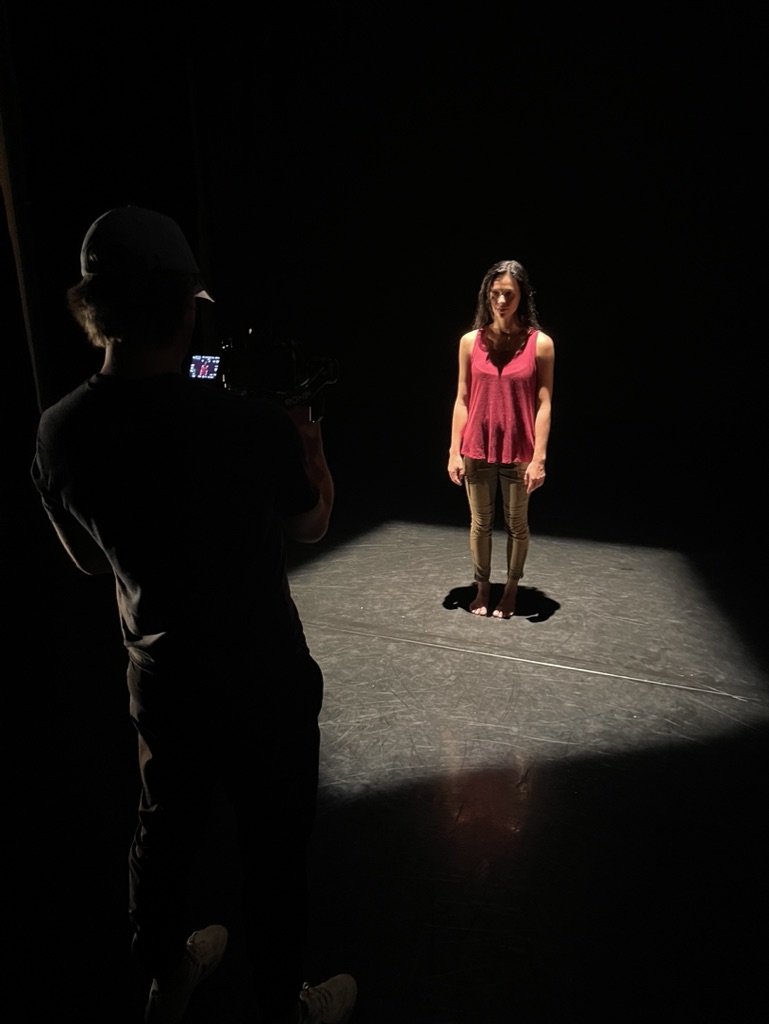
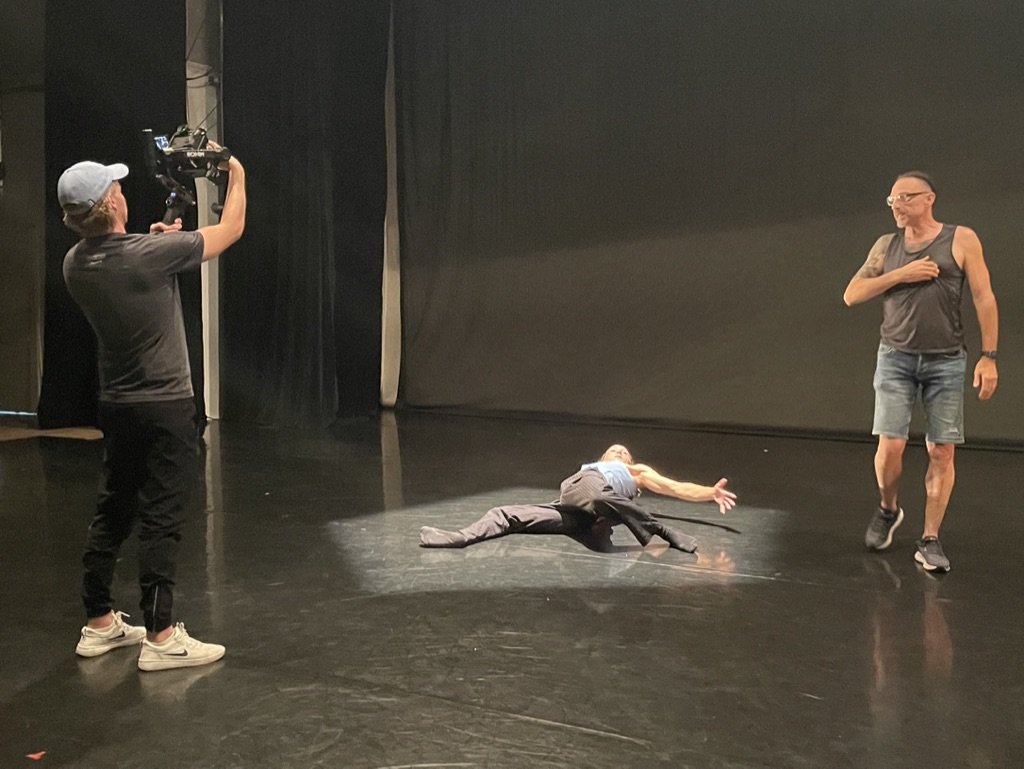
Our initial experiences with sound inspired us to imagine how these same data might be communicated through movement. By teaming up with Roberto Campanella and dancers from his contemporary ballet company ProArteDanza, we pursued the idea further to see what creative expression might unfold.
Expressing Data Through Movement
How is one to interpret data through movement? Our original interpretation and approach are inspired by actual differences existing between different nations in The Economist Group’s Democracy Index Score. Their graph depicts averages of each country’s data over the same 16-year period visualized through the medium of our crystals. The dancers have translated these two-dimensional data represented on the graph into movement. For example, India, which has been the most volatile of these countries during this period, required more pronounced, jerky movements, while the U.S. and Canada, which have been more stable (other than a discernible dip in recent years), experienced less change, therefore requiring smoother movement. The dancers’ movements were captured on film and layered with the musical score.
This installation was featured at the Nuit Blanche Festival in October 2022, and at DesignTO, January 2023 and DemocracyXchange March 2023.
Design TO 2023 Installation
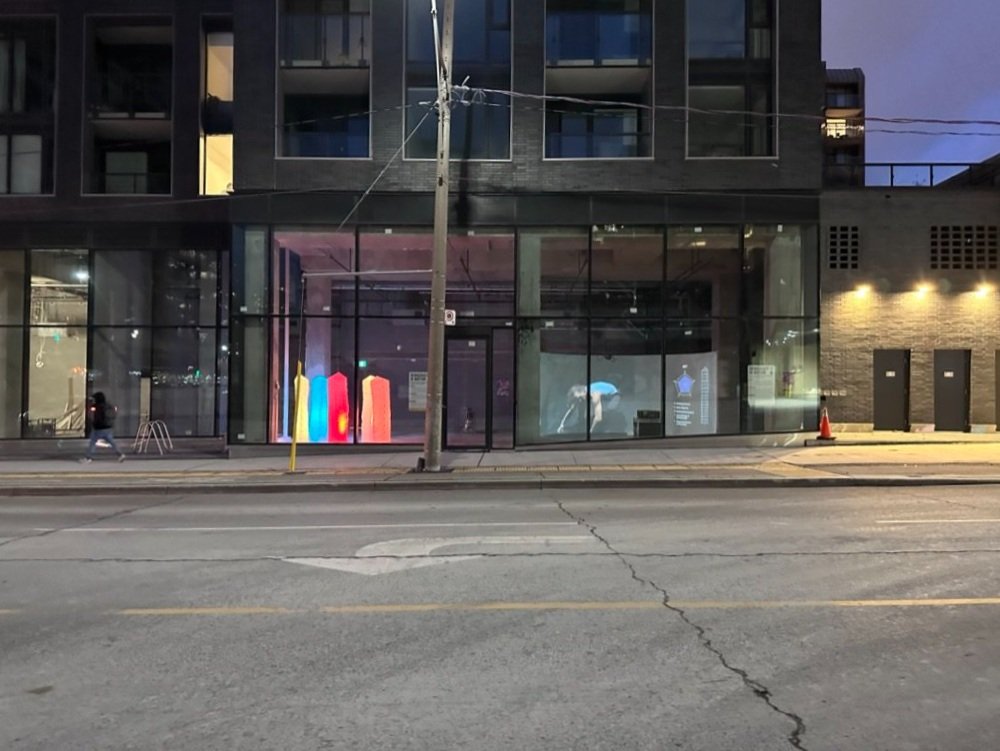
Nuit Blanche 2022 Installation
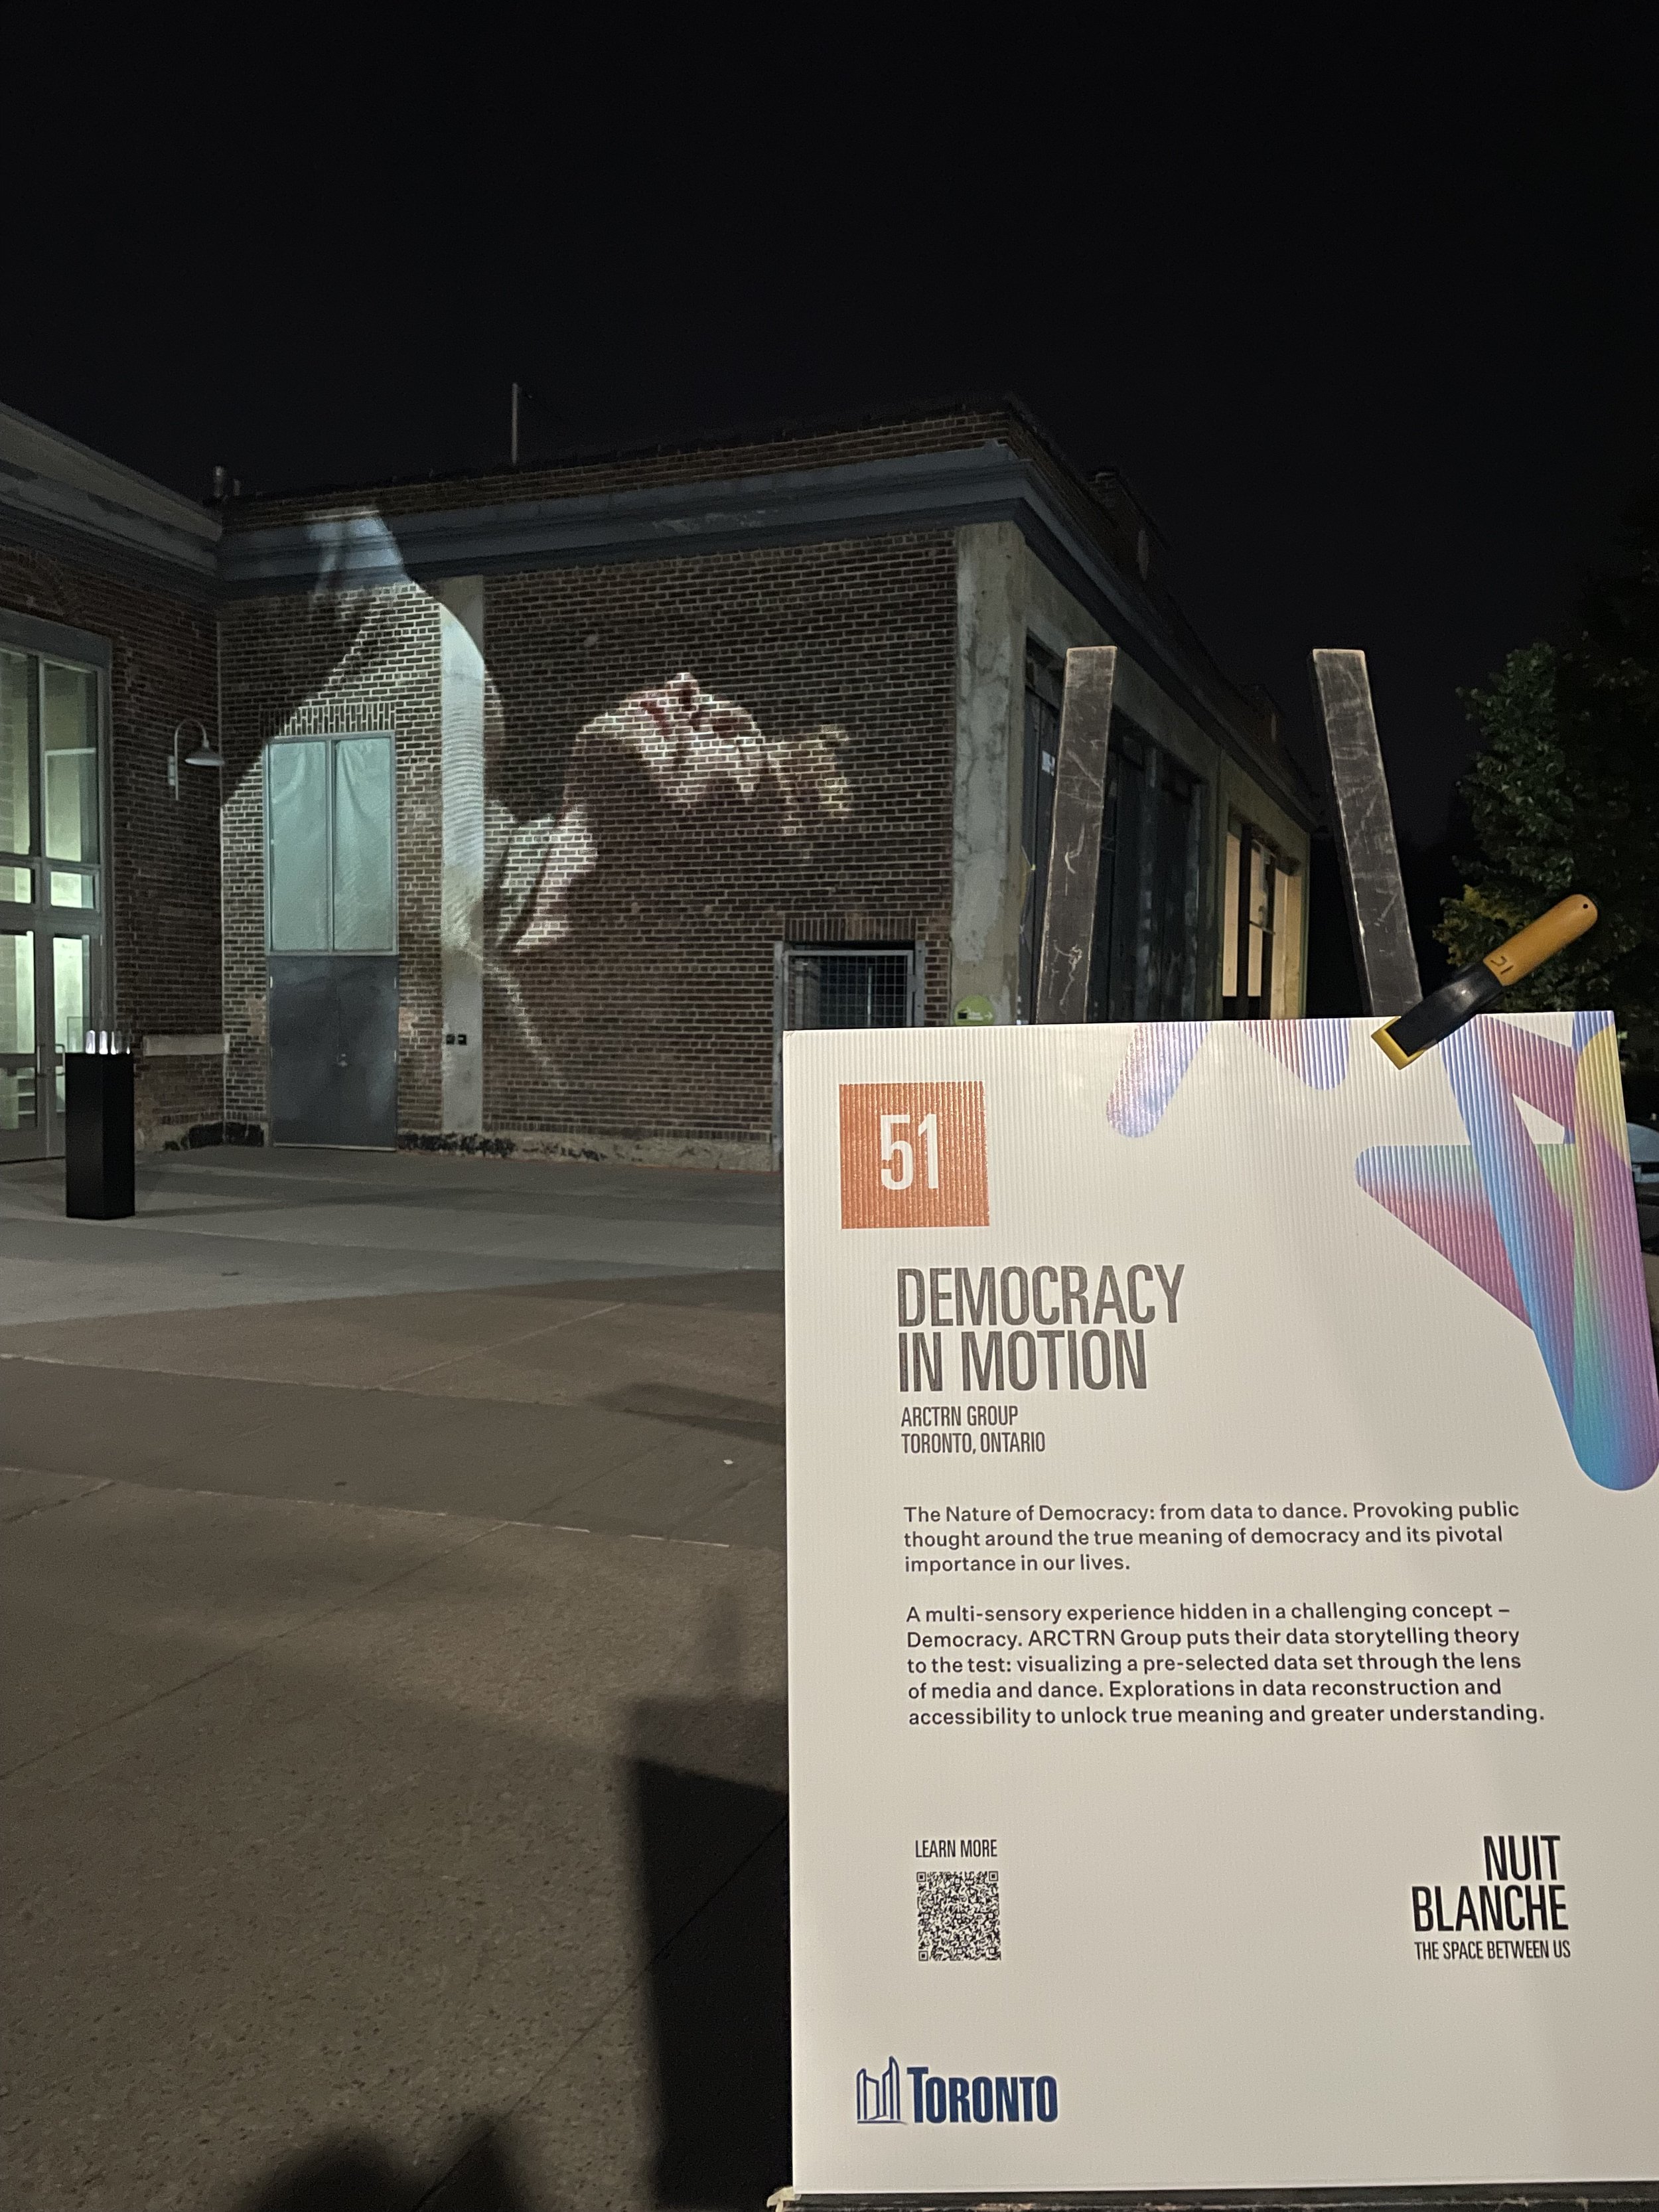
An outdoor scene at night with a brick building and a projection of a dancing woman's silhouette on the wall. In the foreground, there is a sign that reads "Democracy in Motion" and provides information about an event or exhibition in Toronto, Ontario.
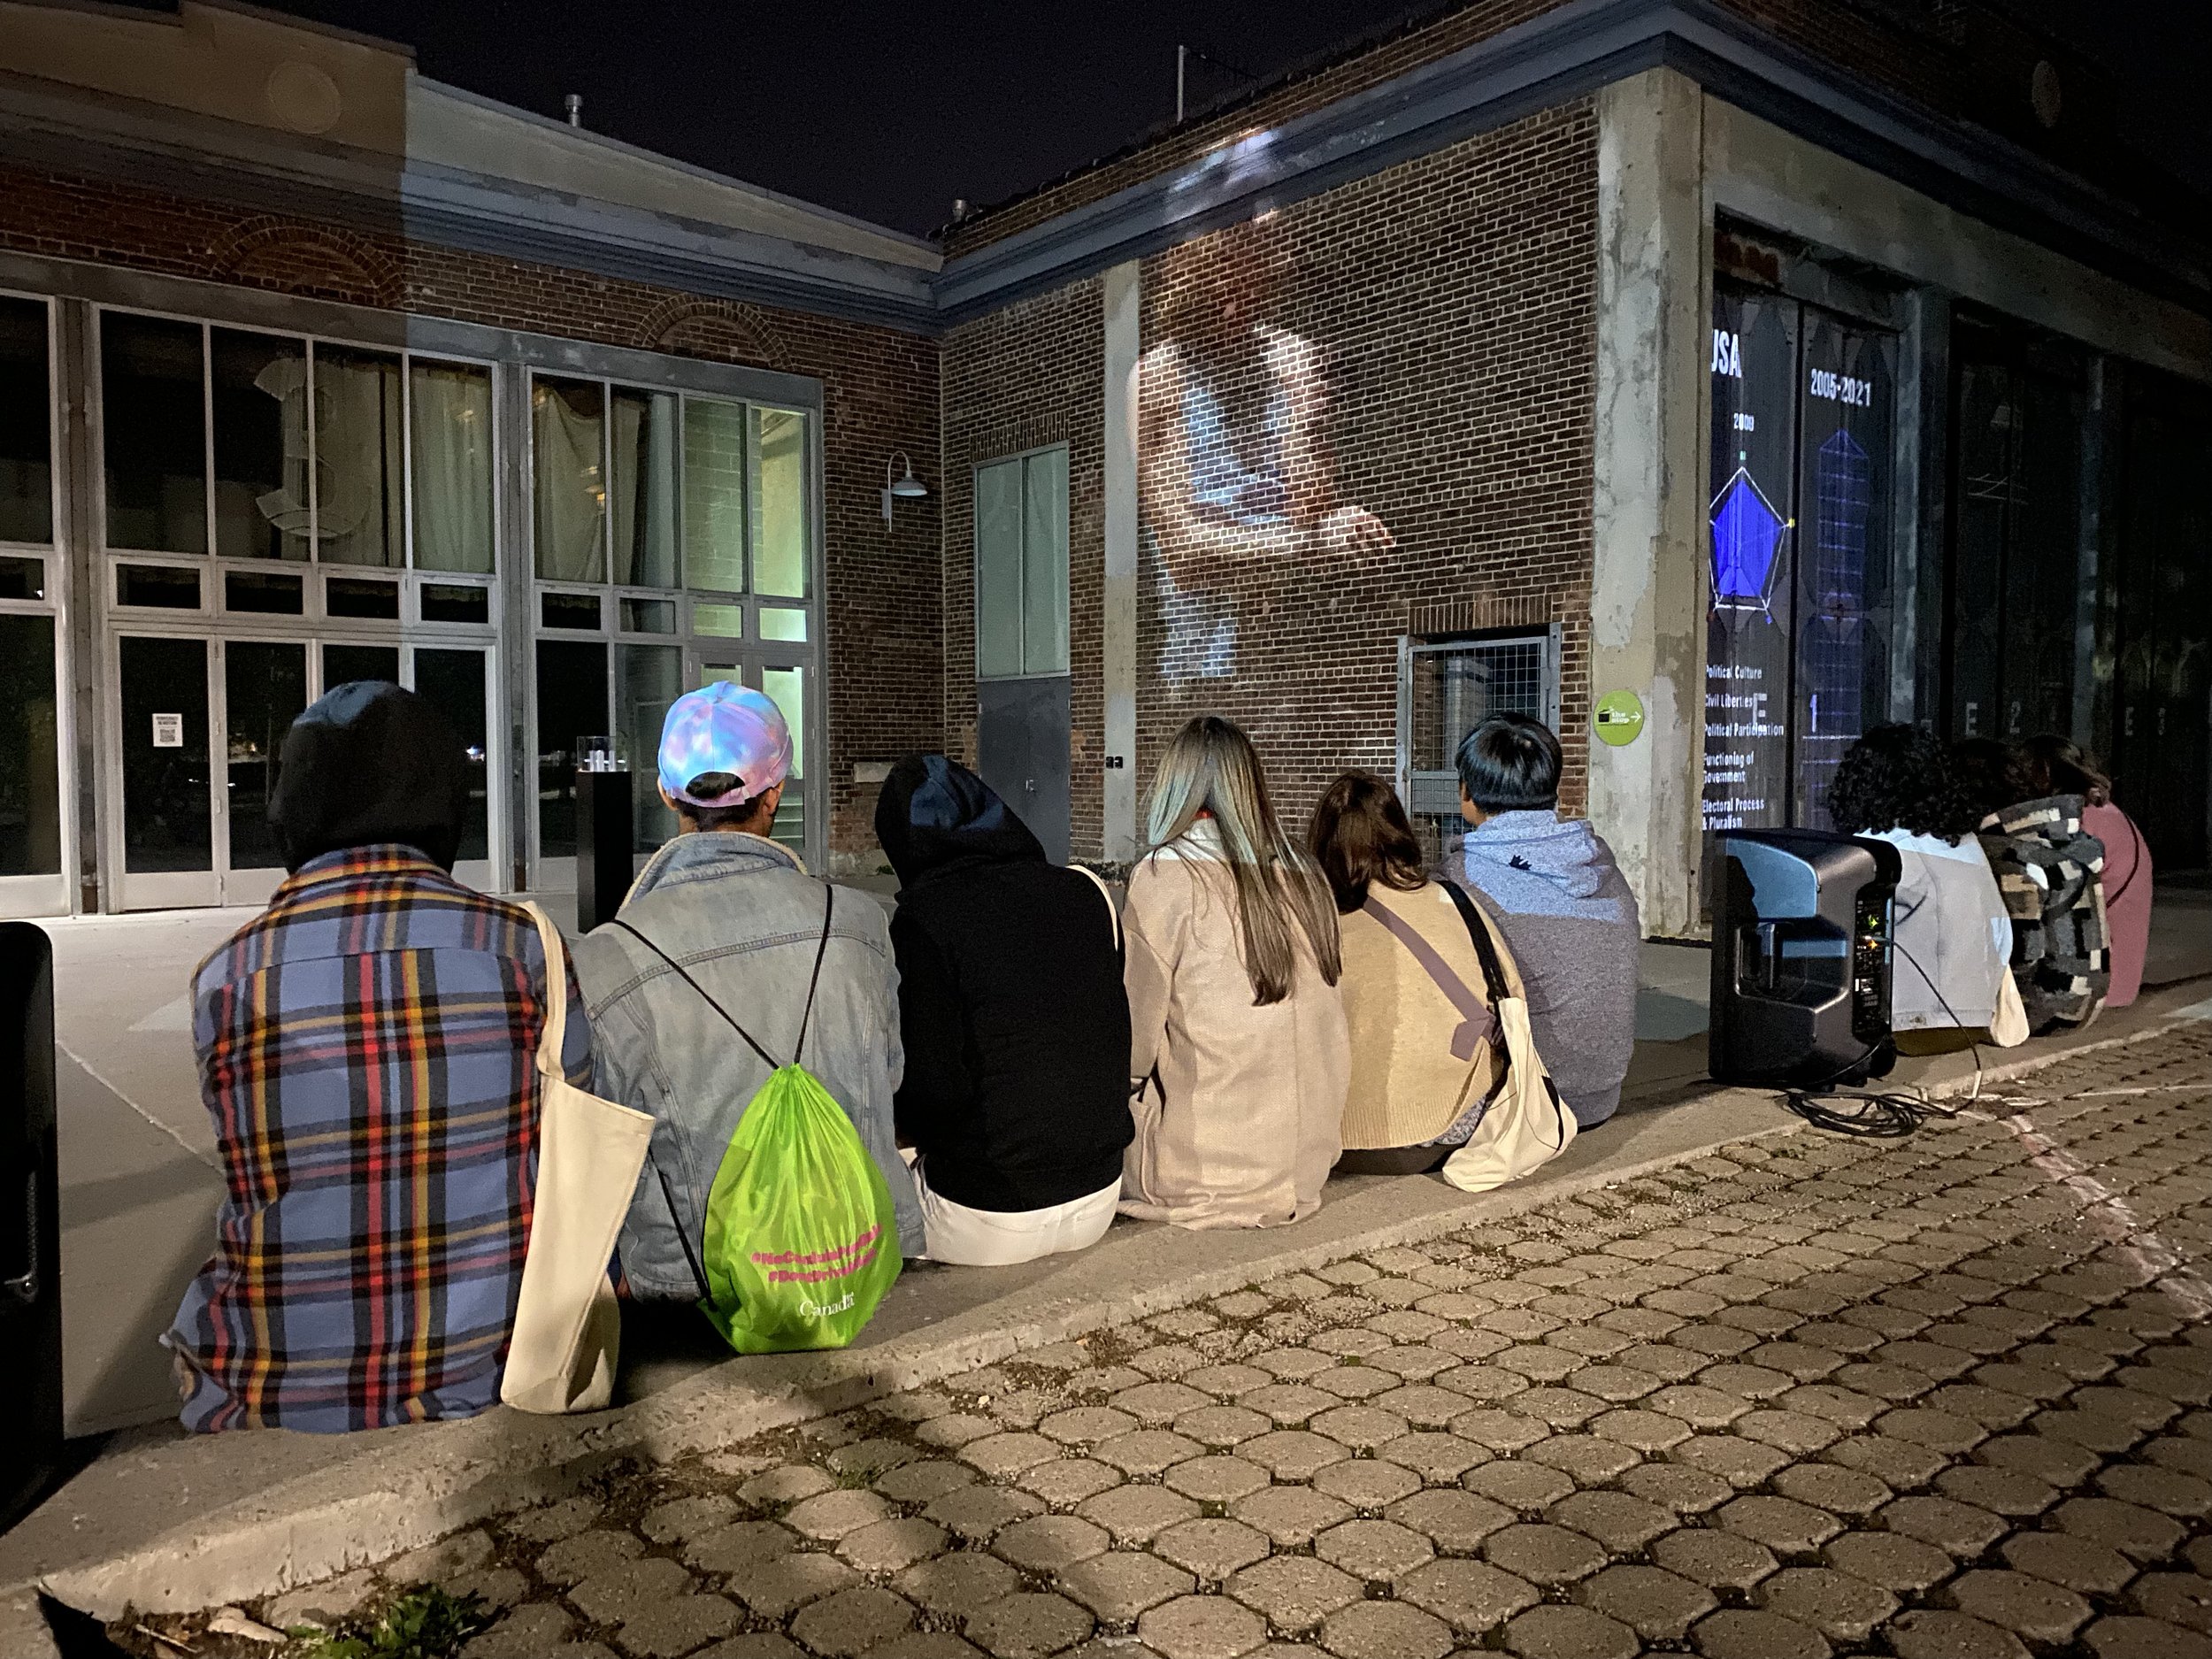
People sitting on a concrete ledge outside a building at night, watching a large projected image on the brick wall of the building.
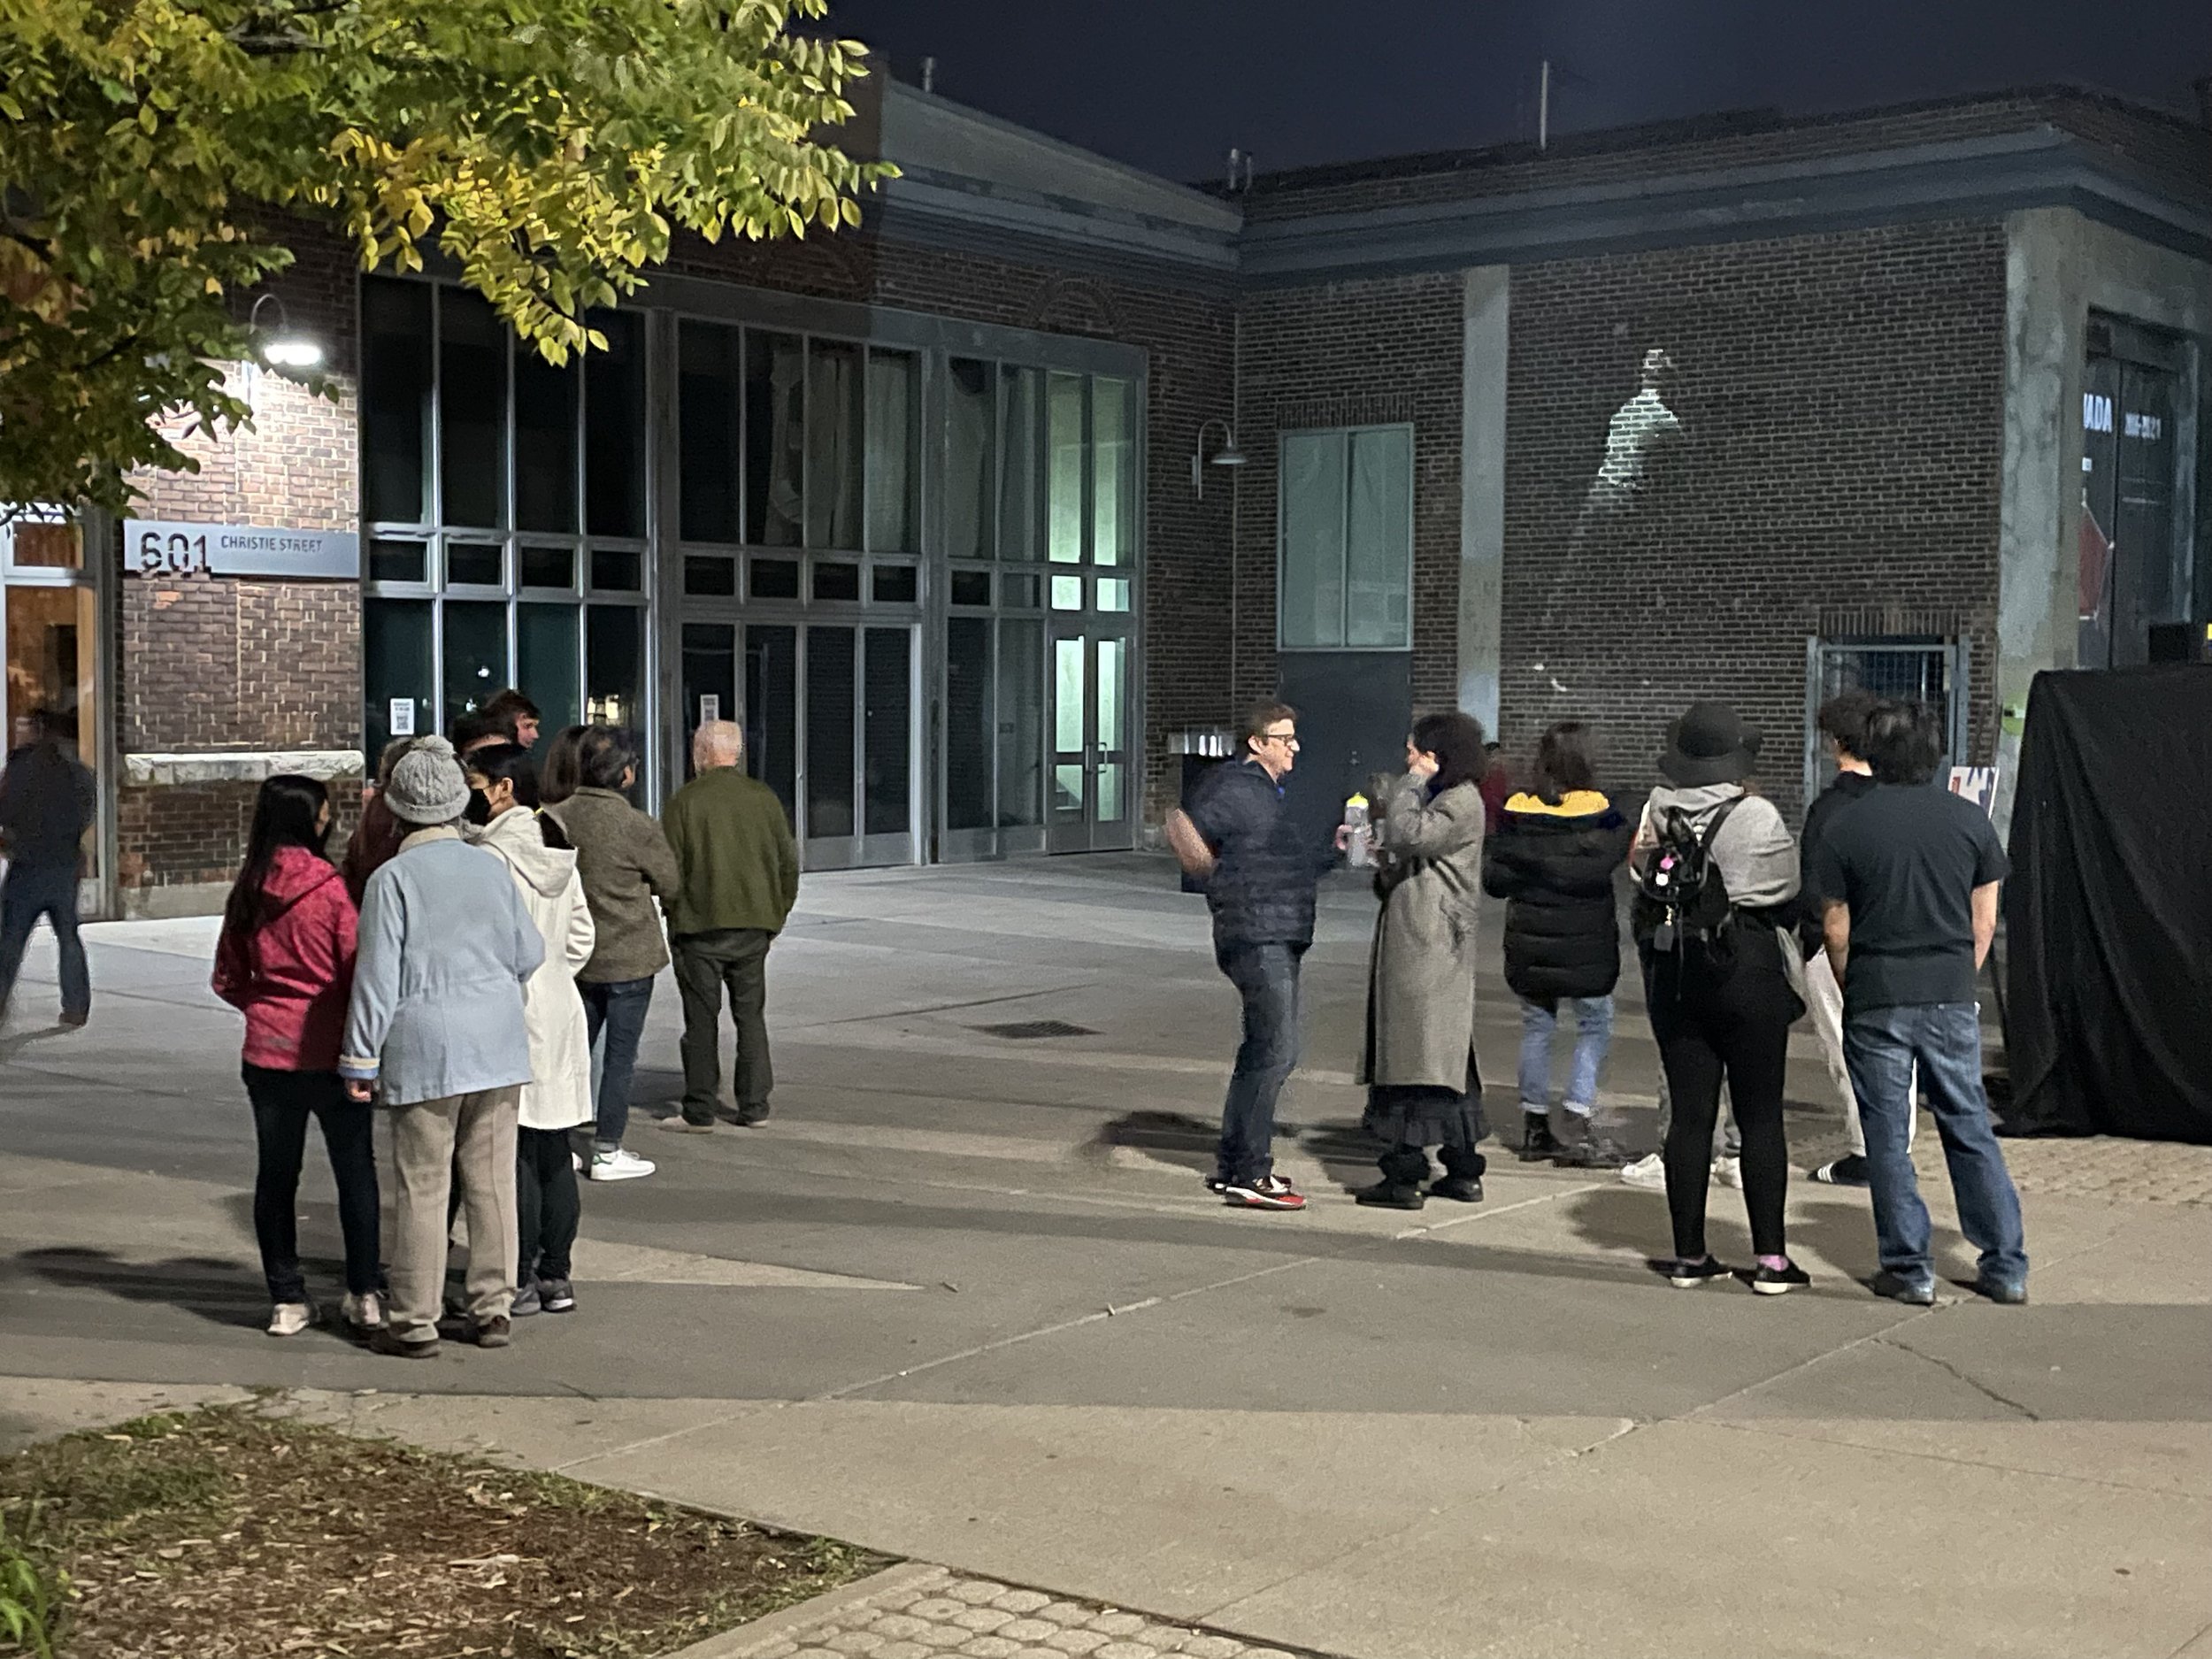
A group of people waiting in line outside a building at night, some wearing masks, on a city sidewalk.
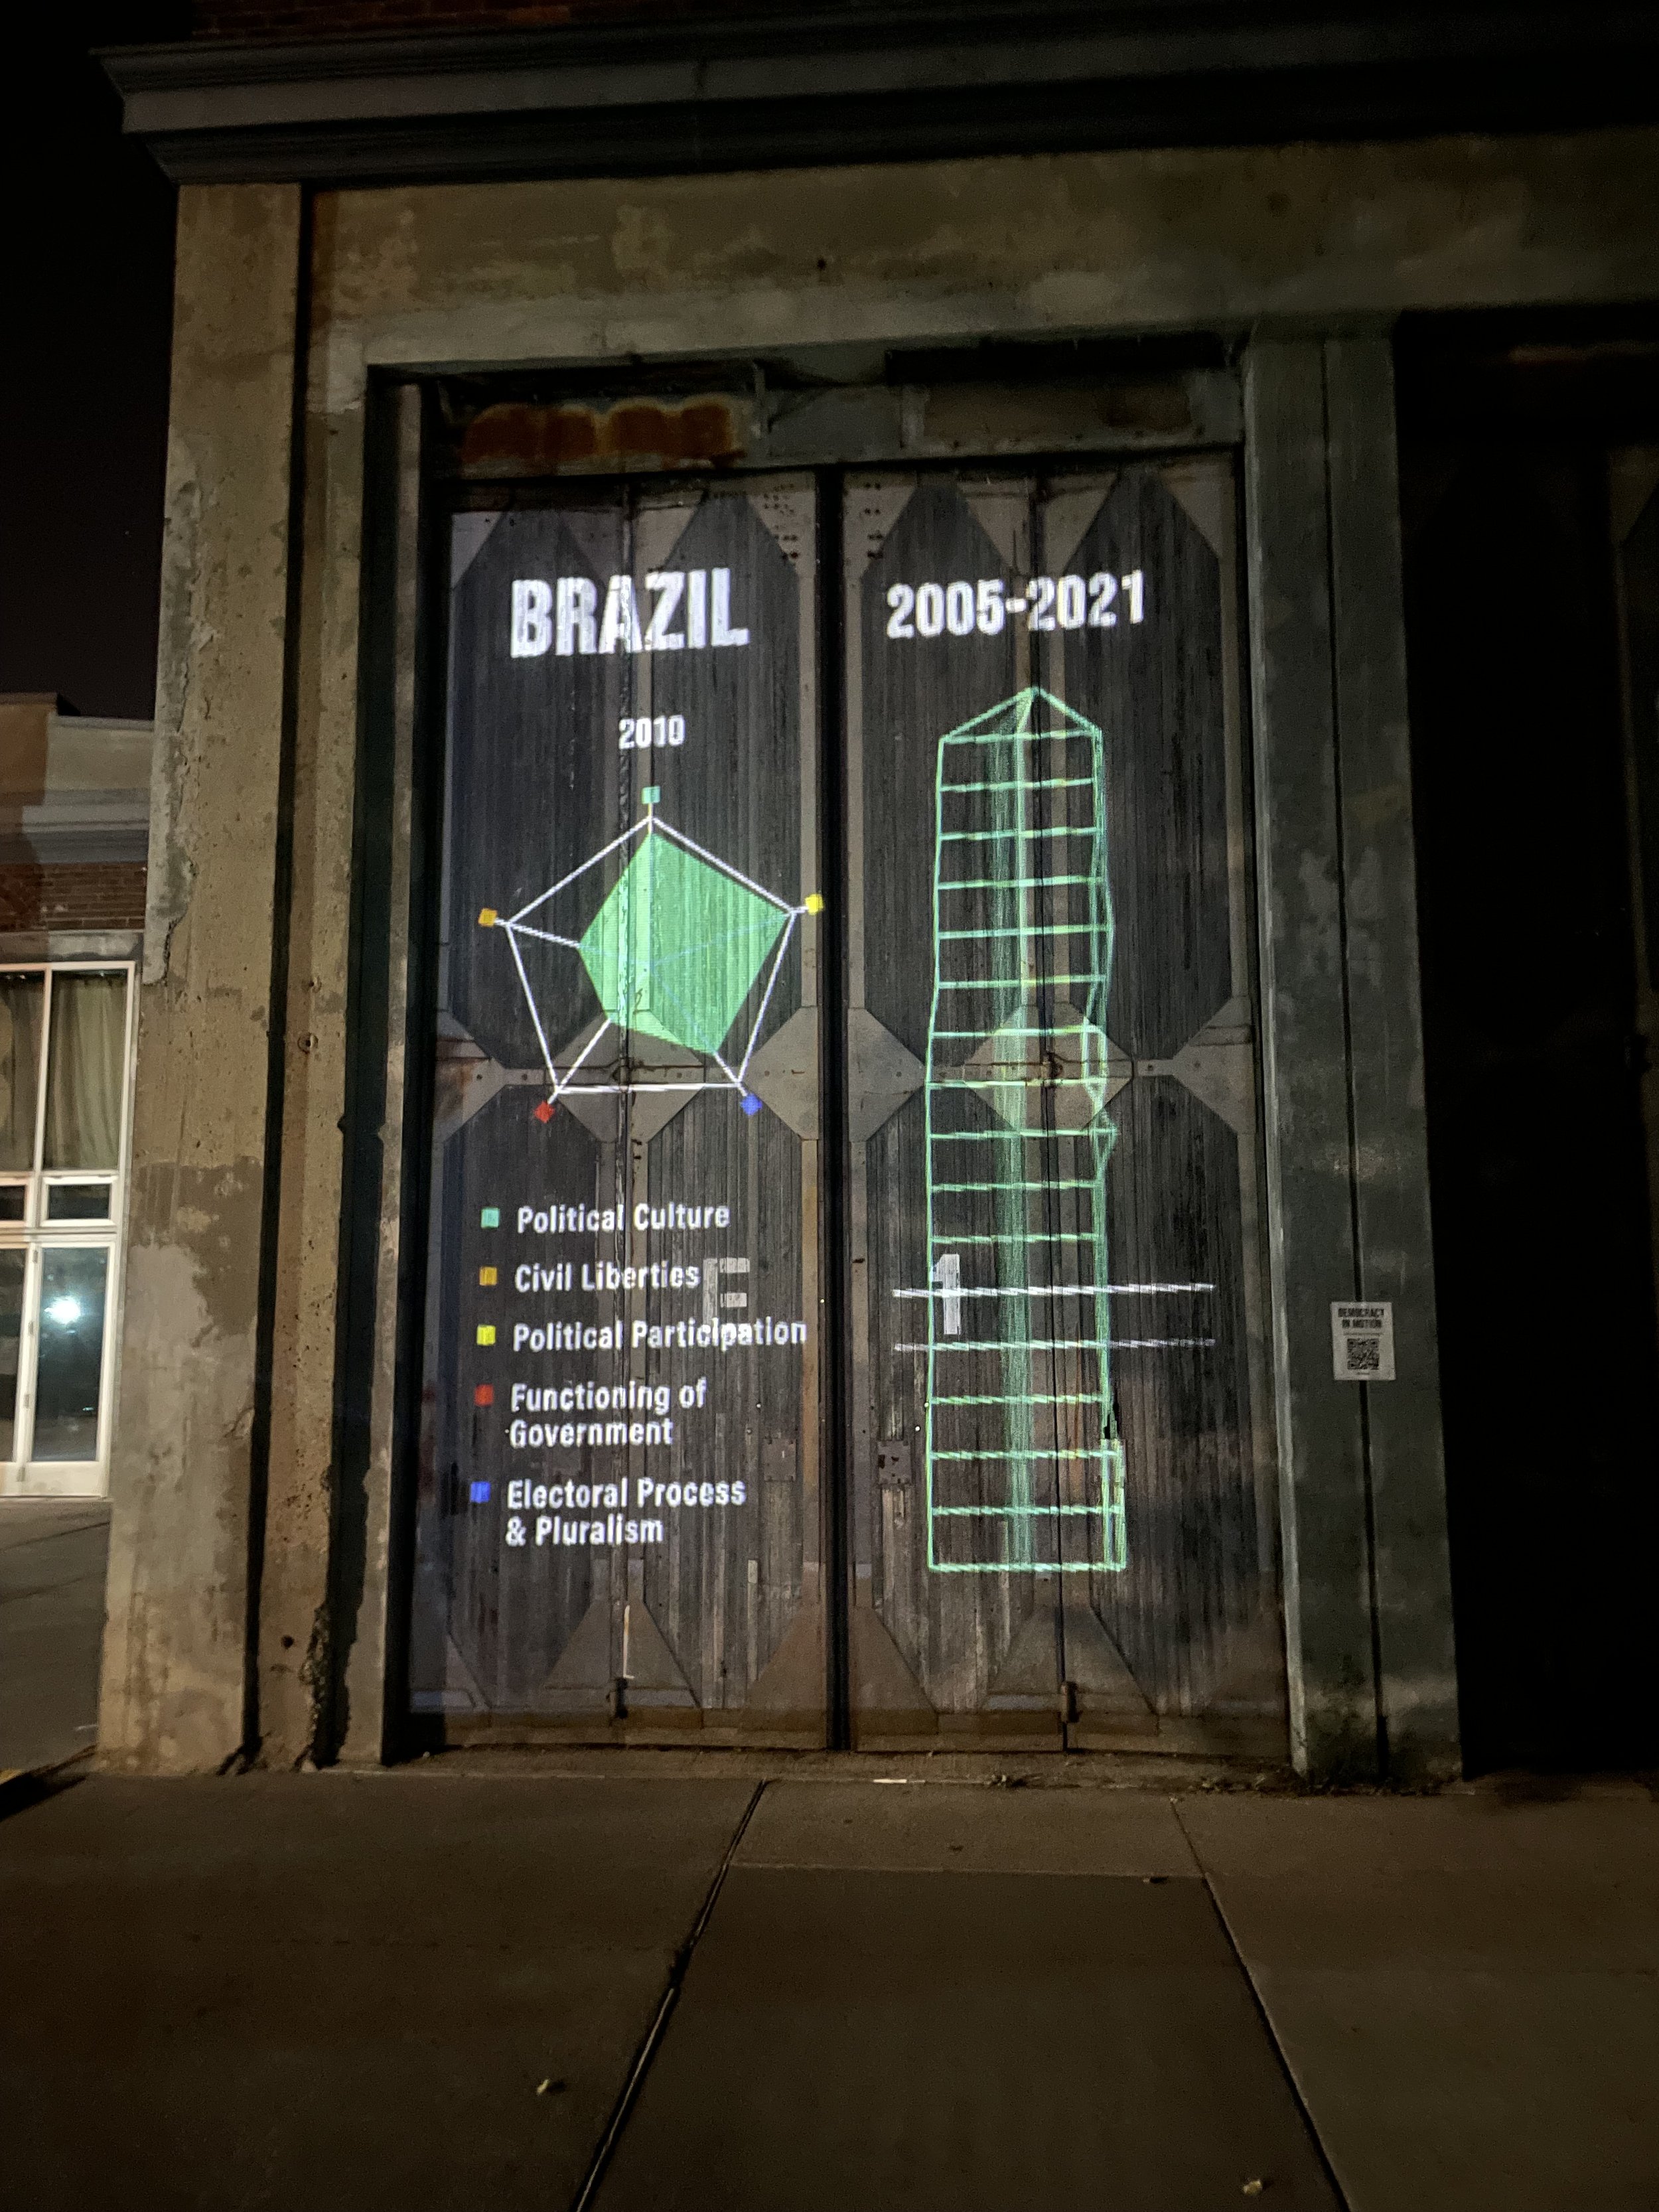
Murals depicting political and civic development in Brazil from 2005 to 2021, including charts for political culture, civil liberties, political participation, functioning of government, and electoral process.
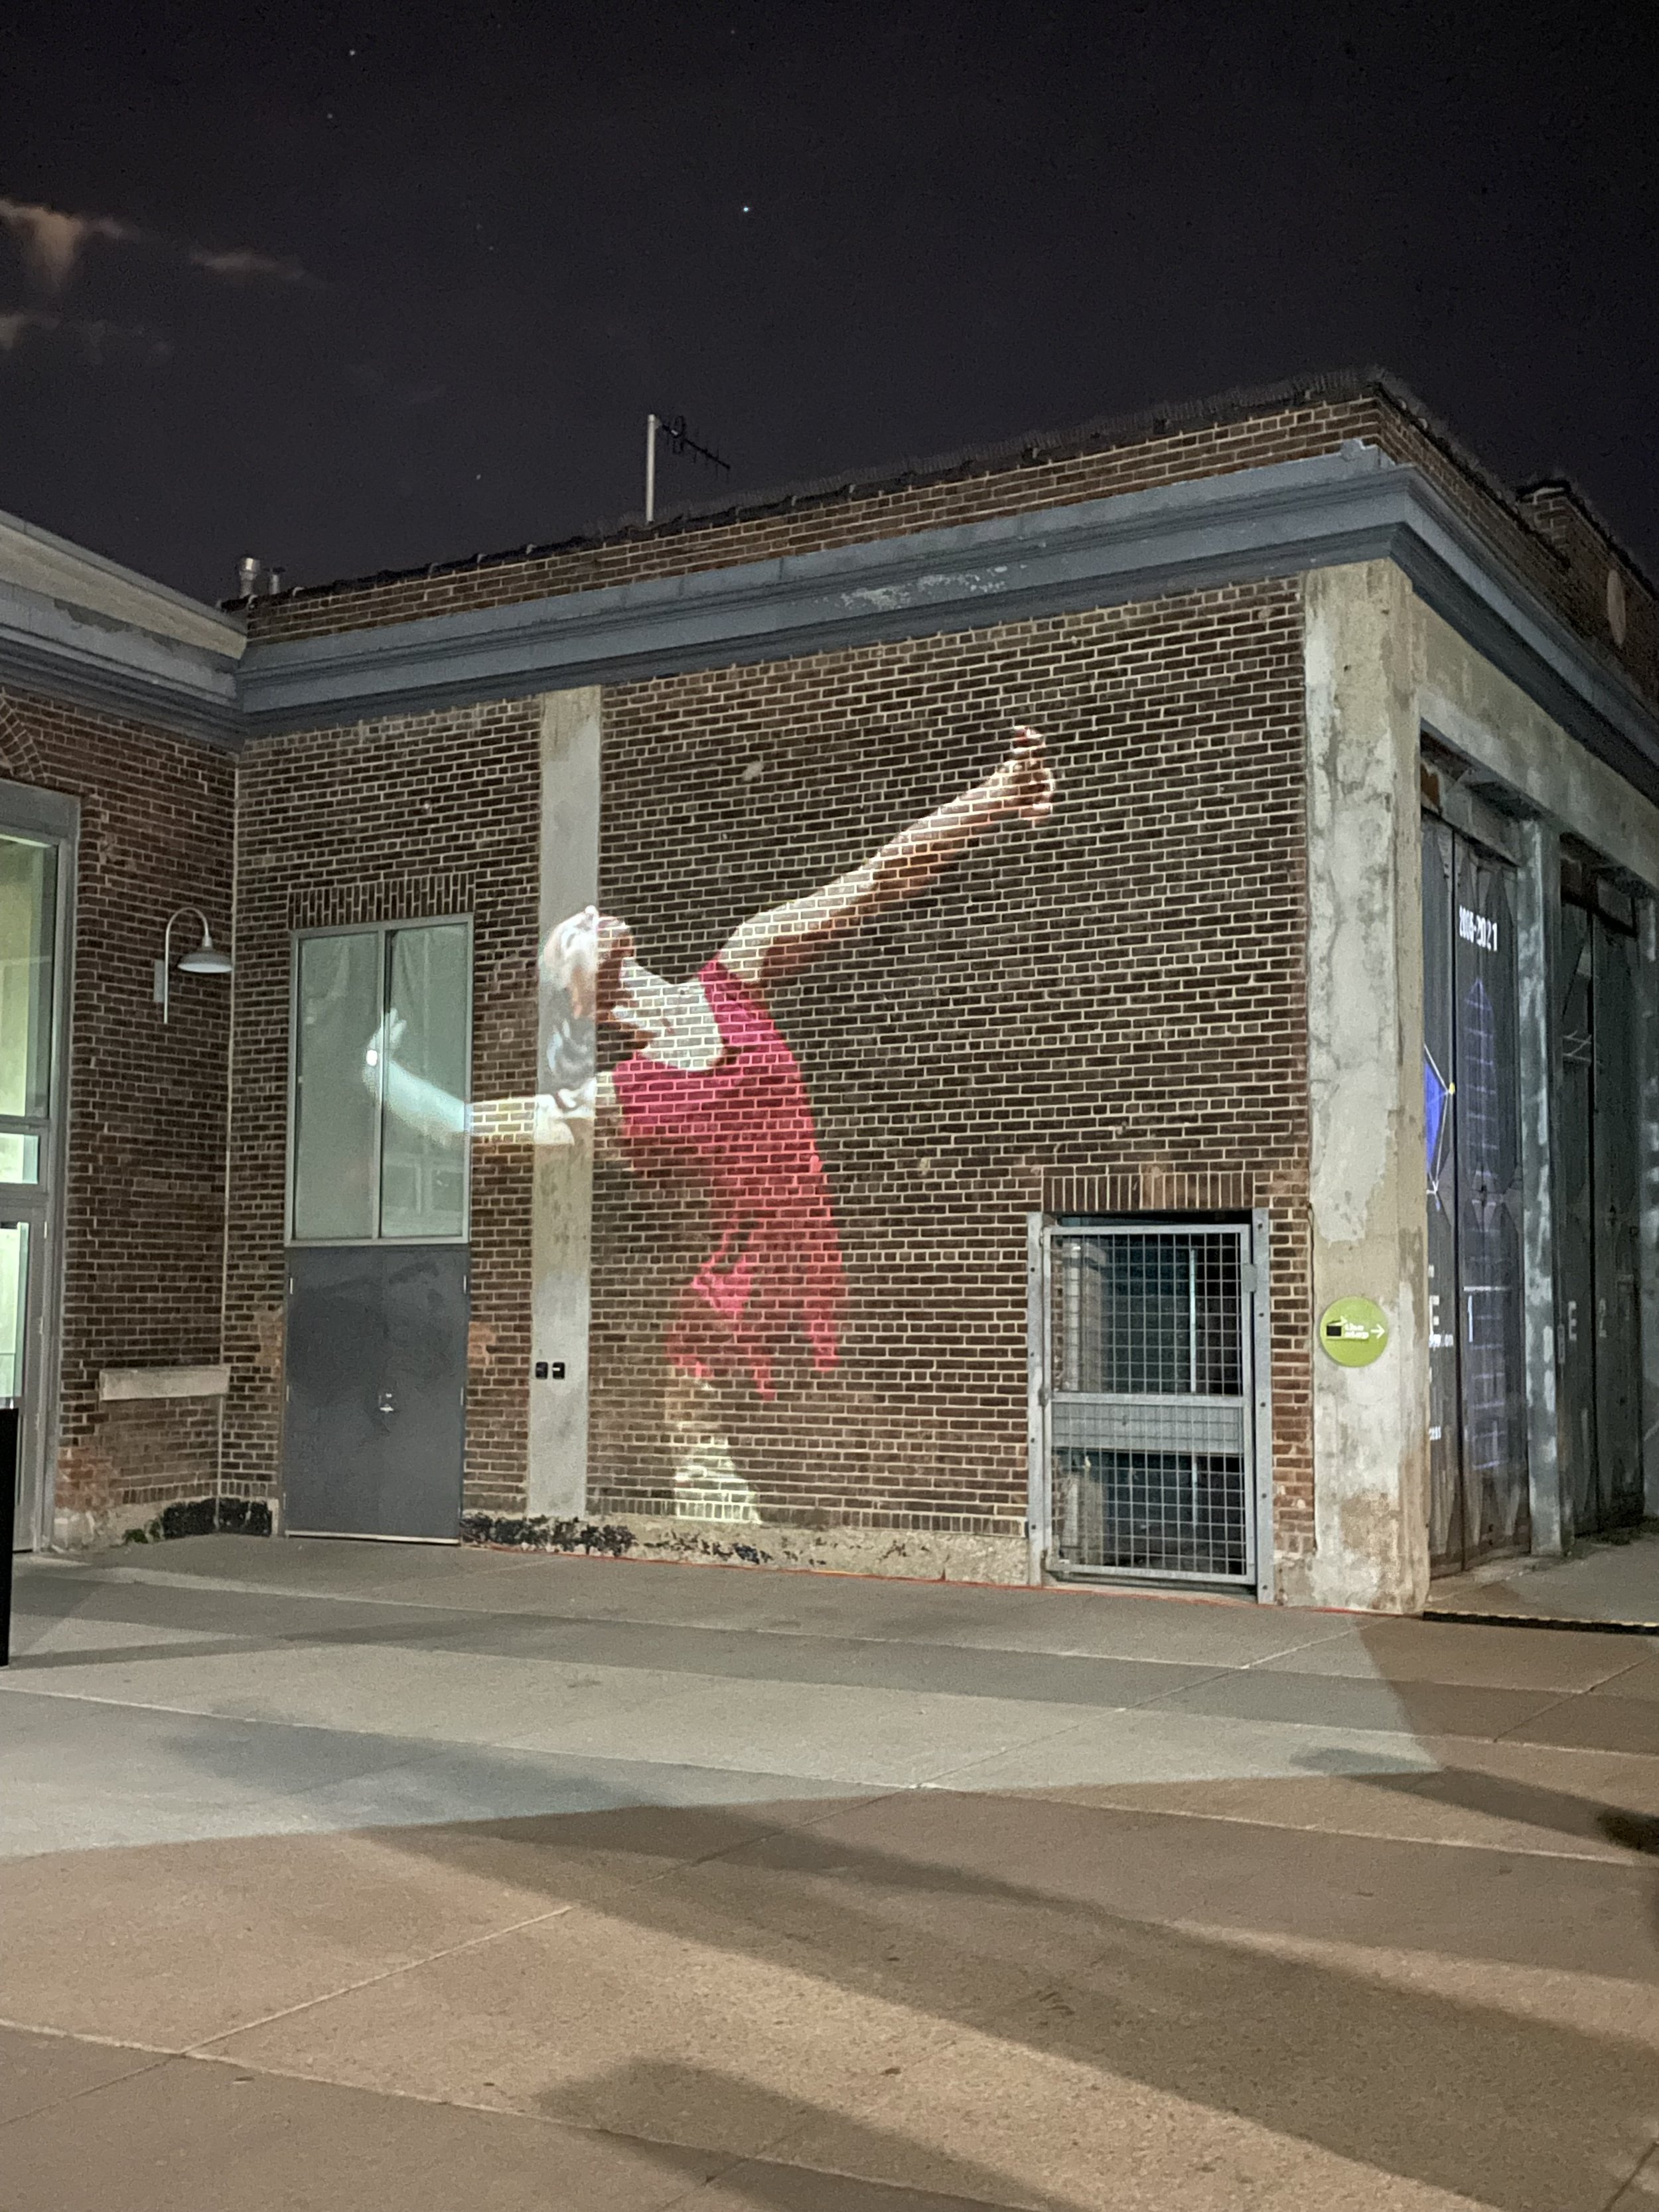
Nighttime view of a brick building with a projection of a boy in a red shirt seemingly reaching up or falling, painted on the wall.
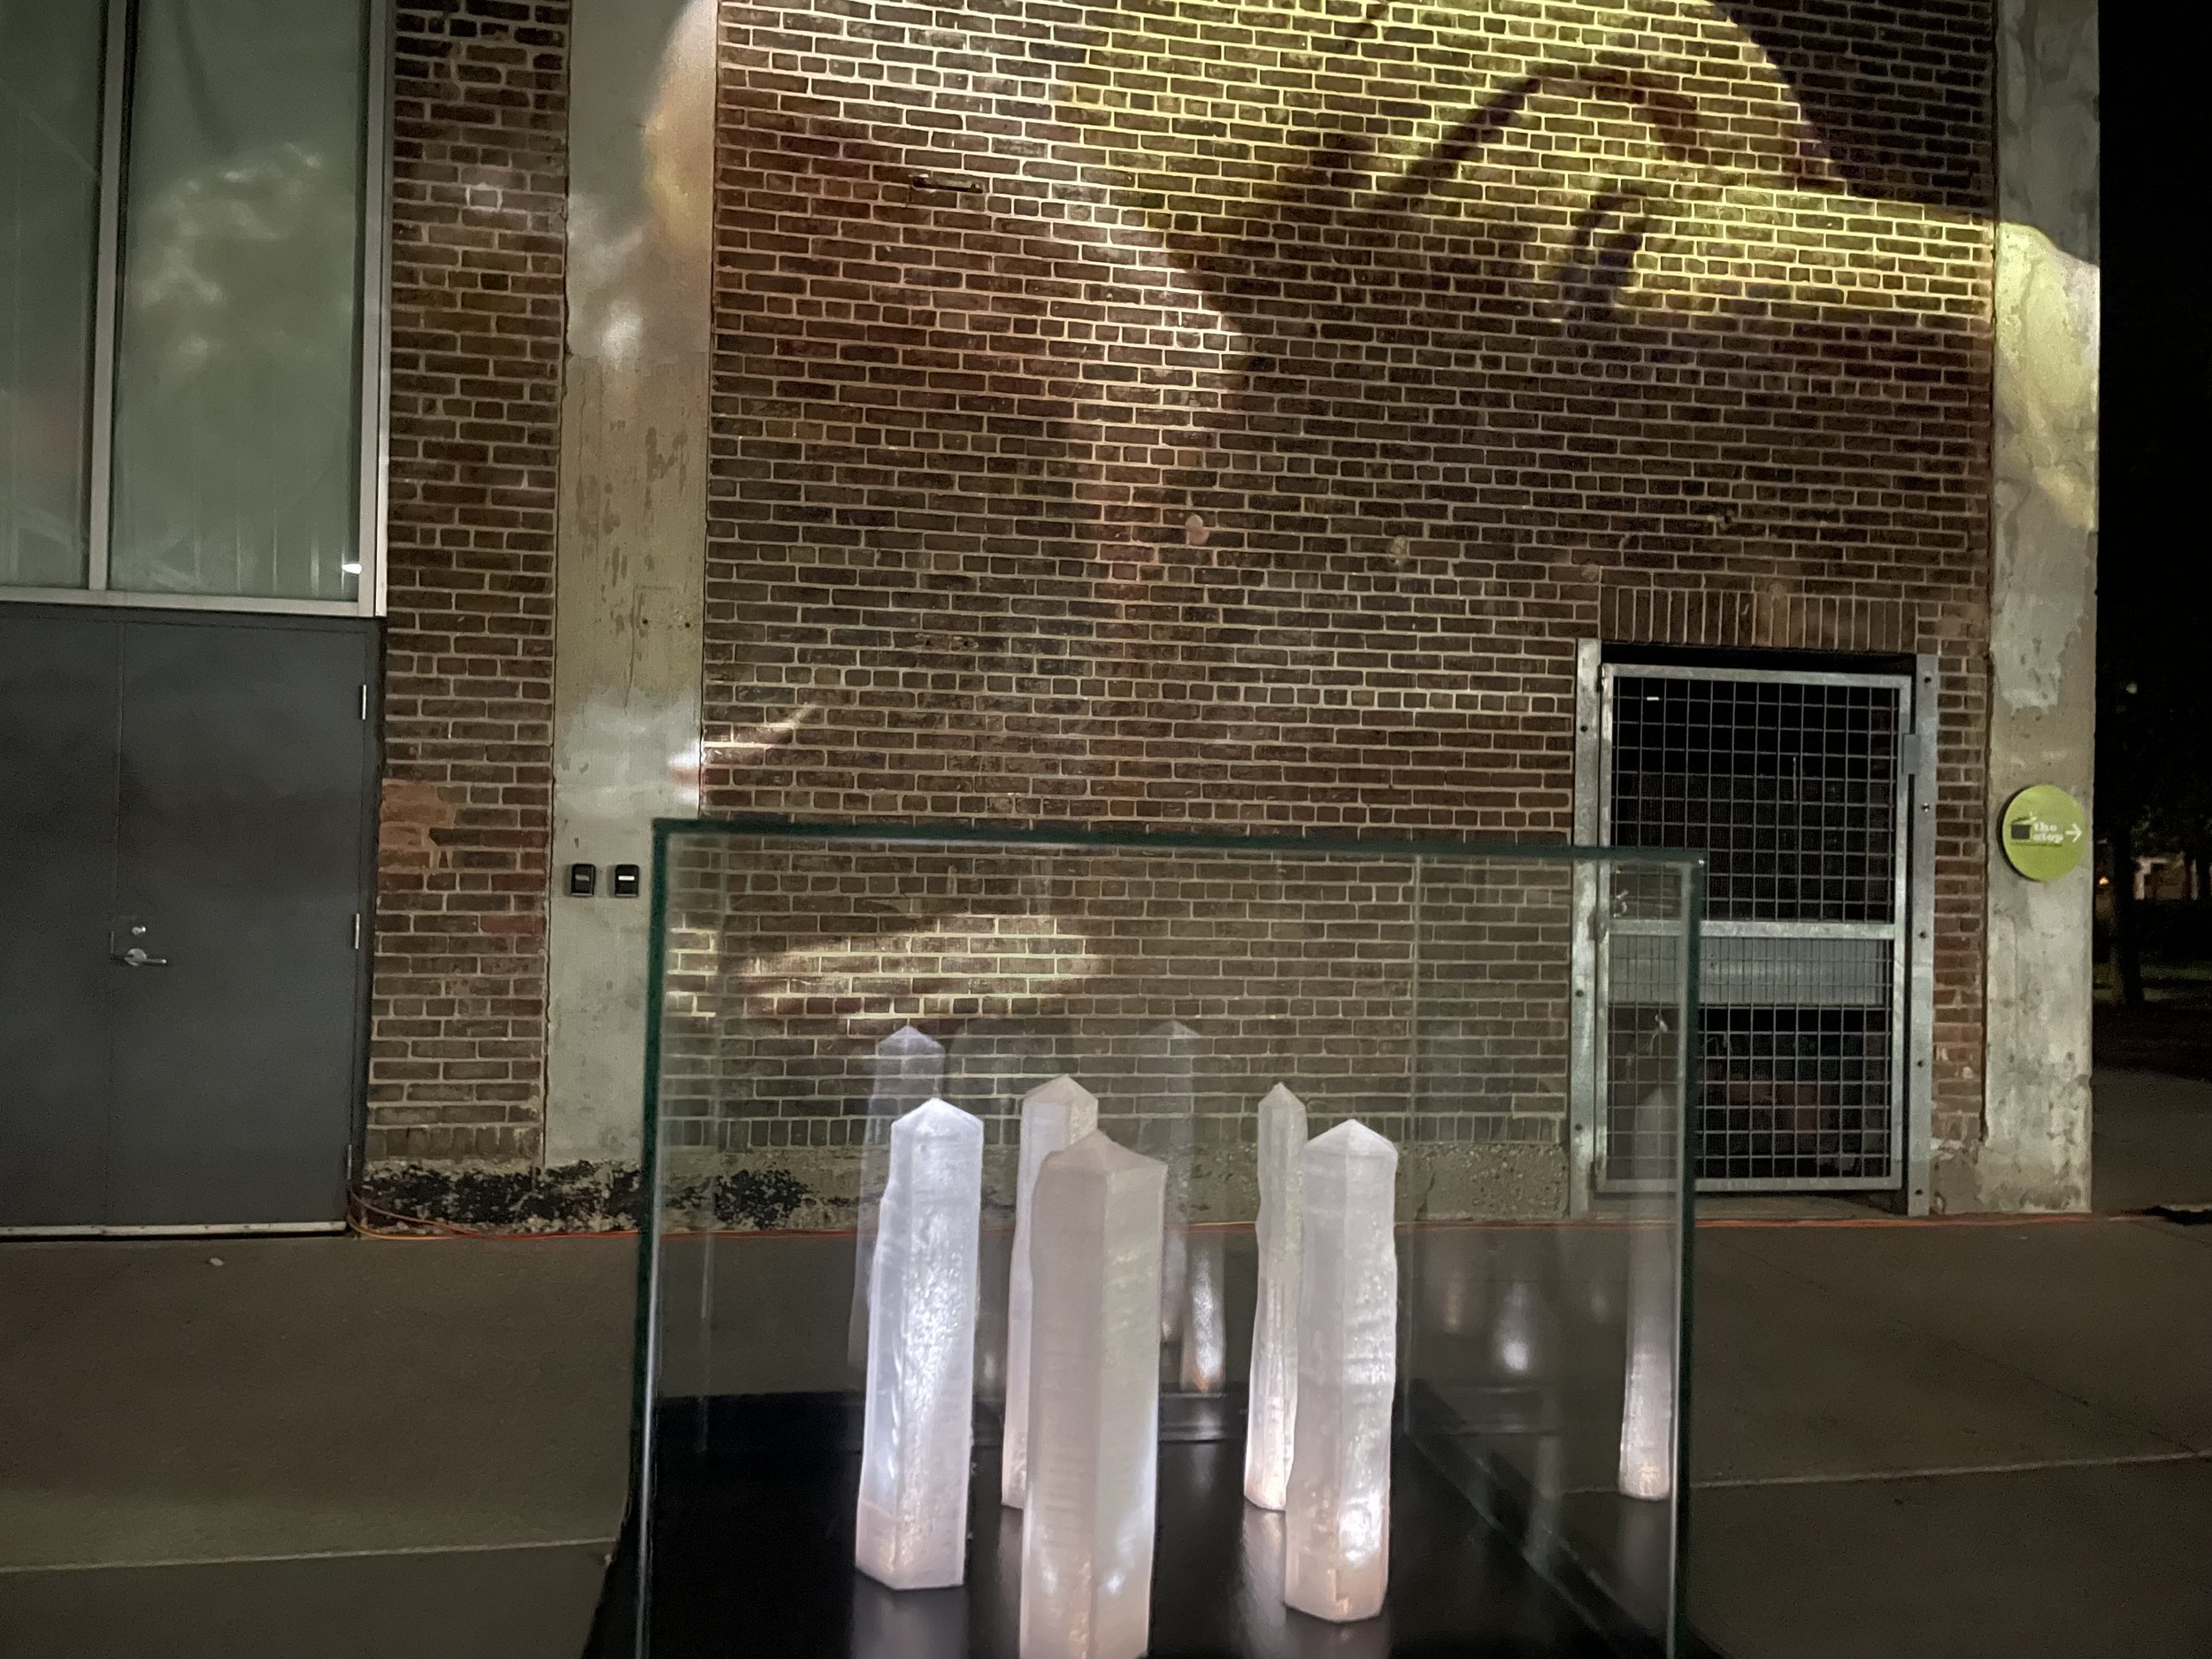
Nighttime scene showing a brick wall with a metal door and a circular sign to the right. In the foreground, there is a glass display case containing illuminated white objects resembling small figurines or sculptures.
We want your opinion! Answer five questions about your take on democracy and how Canada is faring.

Acknowledgements
We at Arctrn are ever grateful for the artists and technicians who have contributed their expertise to this data visualization experiment! Our most heartfelt thanks go out to all our collaborators for their invaluable input and time.Arctrn Collective
Ian Chalmers, Dave Brennan, Brenda Little, Robin UchidaCollaborators
Roberto Campanella, Co-Founder and Artistic Director, ProArteDanzaProArteDanza dancers Sasha Ludavicius, Connor Mitton, Evan Webb, Carleen Zouboules, and Joey Arrigo Andy Huckle Huck Media
Marc Ganetakos, Composer, Musician, and ProducerJustin Hawley, @justmakeralakerArtscape Wychwood BarnsCharles Street Video
Bill Perry: 360° Video Projection System