Translating data into meaningful, actionable stories.

ARCTRN helps organisations find the insights hidden in their data. We use a human-centred design approach to uncover the stories within the numbers, making complex information clear and actionable. Our data visualization work transforms raw data into compelling visuals that drive understanding, inspire change, and to better inform human decision making.

A new way of seeing information that would otherwise remain unseen.
We create a connection between people and data. Leveraging the discipline of data visualization, we harness data — commonly represented in reports or overly simplified charts — to empower participation in and the understanding of that data. This encourages a shift toward analytically driven businesses, where users can explore data in various forms of graphical representation, revealing insights and delivering greater understanding.

Graphic Information Design (GID)
This is all about making complex data easy to understand. We turn complicated data sets into clear, compelling visuals that grab people's attention and help them take action.

Behaviour Interaction Design (BID)
Our goal is to uncover what motivates people within a data set. By using interactive tools, we can gently guide and influence behaviour over time, introducing subtle changes in a phased approach.

Realtime Experience Design (RED)
We translate data into multi-sensory experiences and installations. Our work is designed to engage users on an emotional level, helping them connect with and understand complex information more profoundly.

Democracy in Motion
A multi-media installation exploring the visualization of an existing data set about the state of democracy in countries around the world.
I AM HERE
An abstract lighting display installation running low-fidelity graphics.

Just Stop. Just Start.
A social campaign targeting single-use plastics in our daily lives.
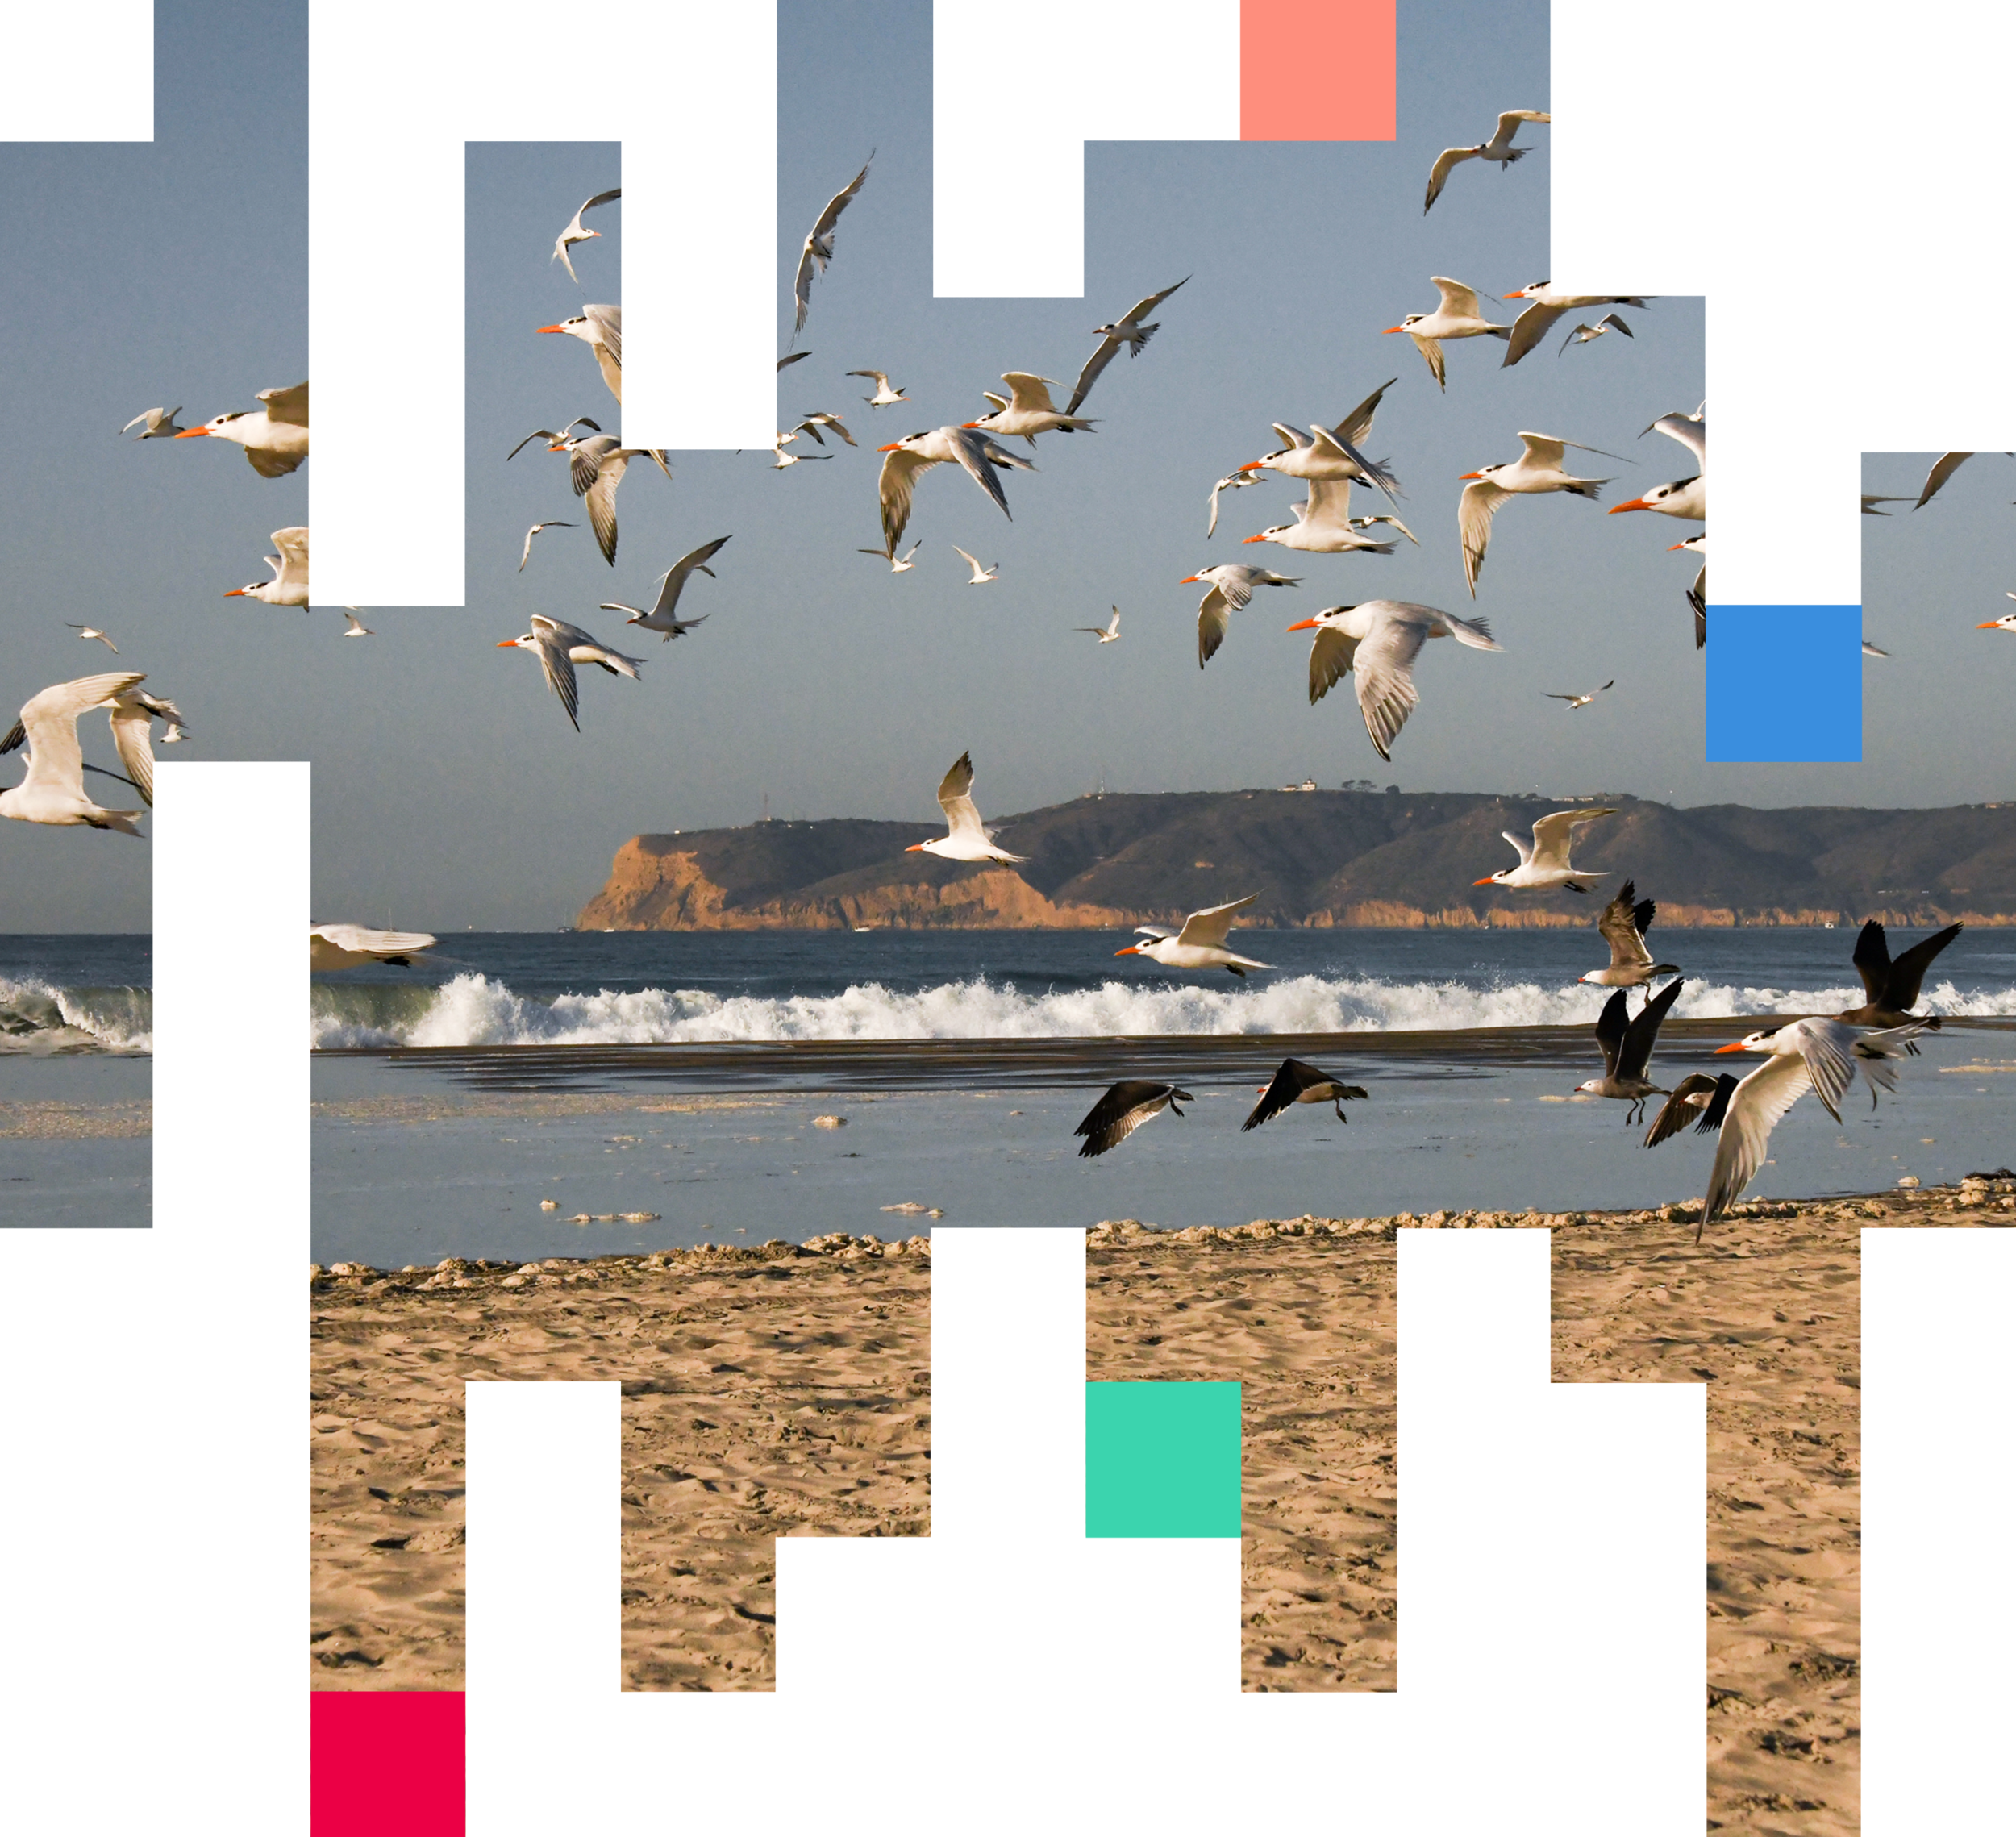
Every year, arctic terns migrate from the Arctic to the Antarctic Circle.
To accomplish this round-trip journey of about 30,000 kilometres or 18,641 miles, they use stars, the landscape, reflections, shadows, temperature and scent to navigate — seeing the world through different sensory perspectives.
Taking a cue from these incredible species of navigators, how might we humans look at the world with a different perspective? With effective communication of the truths inherent in data, we can inspire action through understanding and relatability.
Ready to turn your data into a strategic asset?
Contact us for a free assessment of your data needs and ways we can help you translate it into creative, meaningful, and actionable insights.
ian@arctrn.com
416-838-4376 Toronto office
213 Sterling Road, Unit 107
Toronto, Ontario M6R 2B2
Canada